Statistics plugin
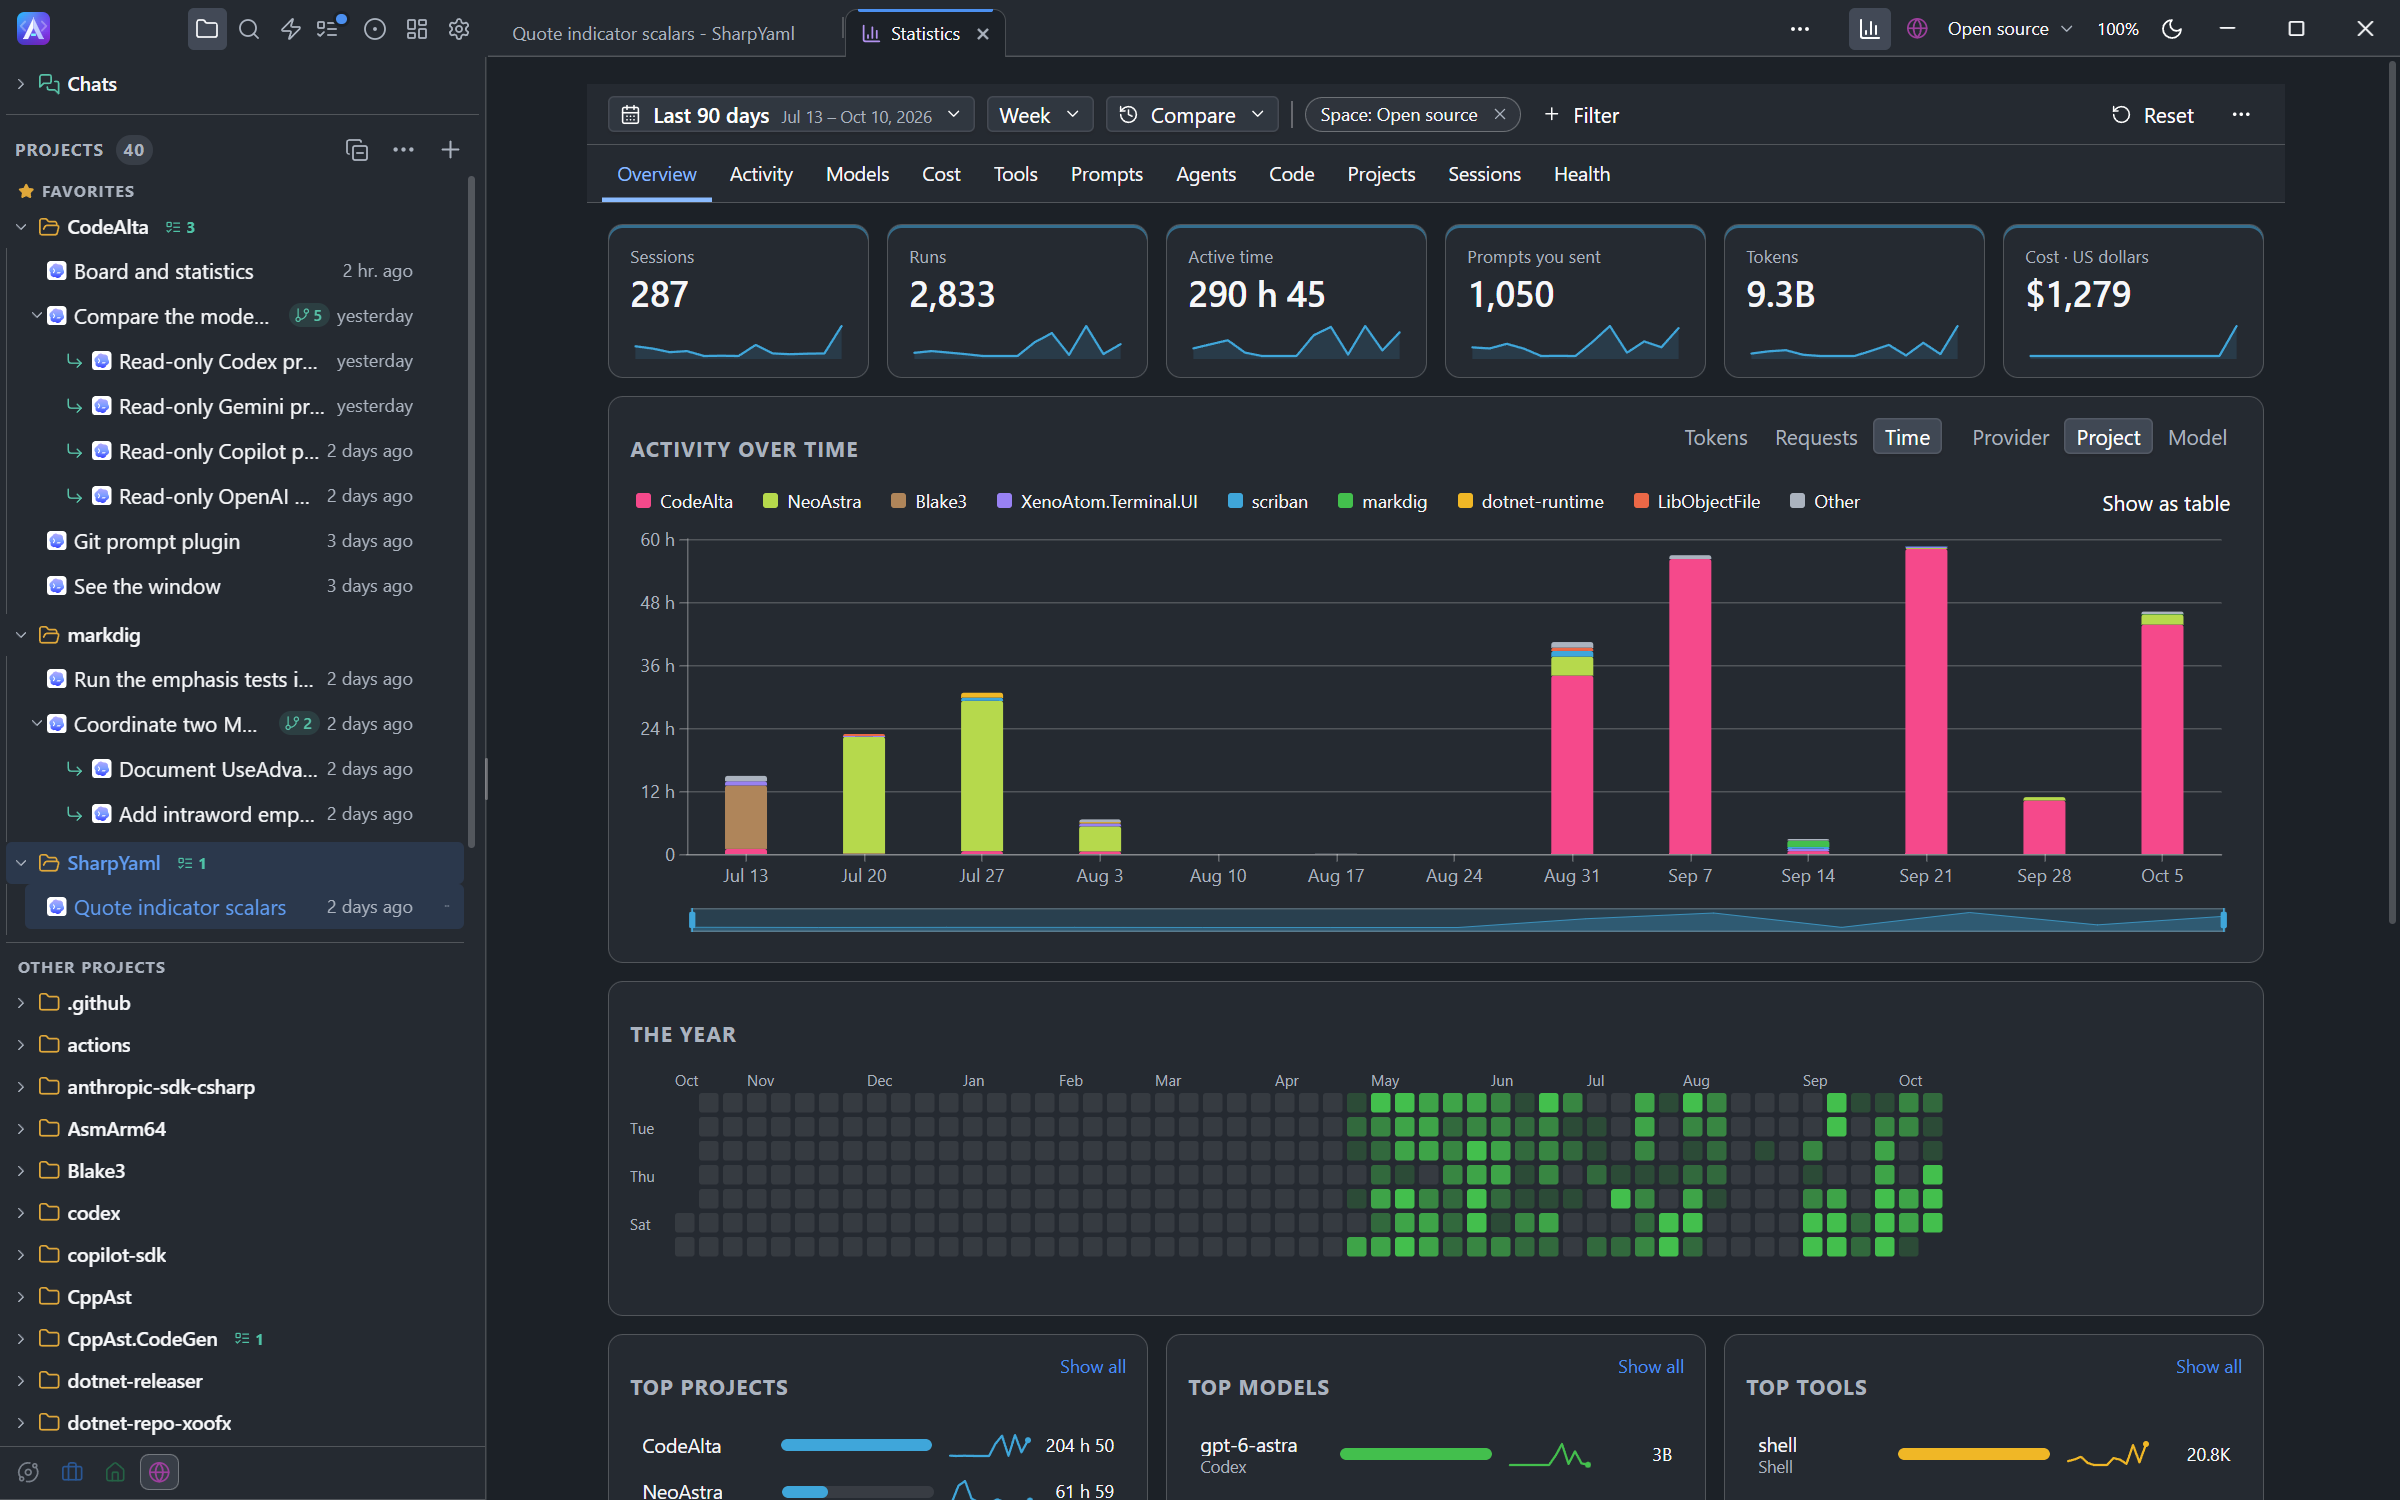
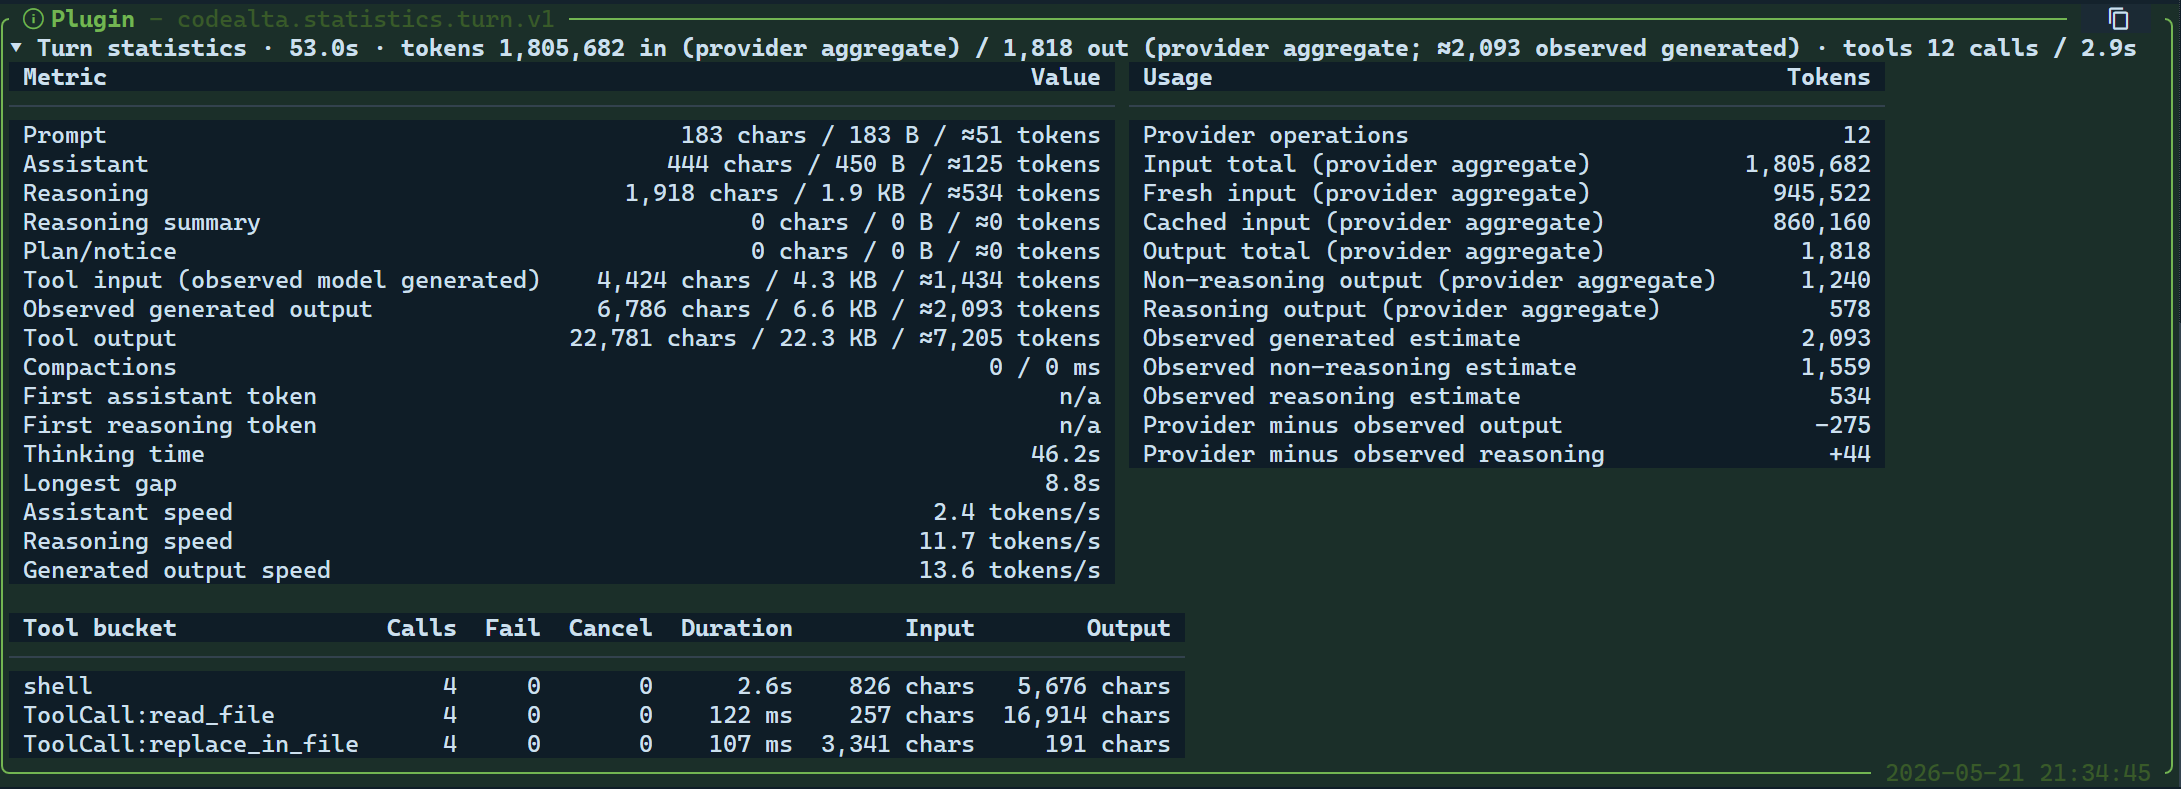
The built-in statistics plugin shows how you use CodeAlta. It adds a card of statistics to each turn of a session, and CodeAlta Desktop also keeps the numbers of all your sessions, over time: sessions, runs, active time, prompts, models, tokens, tools, and the cost where a provider gives one.
What it contributes
- A statistics card for each turn and session in the timeline.
- In CodeAlta Desktop, the statistics of every session, kept up to date while sessions run and built from the history the first time.
- The
alta statisticscommands, which agents use to read the numbers and to estimate the size of a text.
The card is not stored as assistant or user content. The session keeps its own records, and the plugin derives the card from them.
Open the statistics
In CodeAlta Desktop the numbers have a page of their own, in a tab. Open it from:
| Where | How |
|---|---|
| The title bar | The Statistics button at the top right, before the space switch. It shows a small ring while your history is being read, and a dot while it waits for you to choose how much to read |
| The keyboard | Ctrl+G, then C |
| The search | Statistics, or /statistics |
| A project | Statistics of this project in the menu of a project row opens the page for that project only, in a tab of its own |
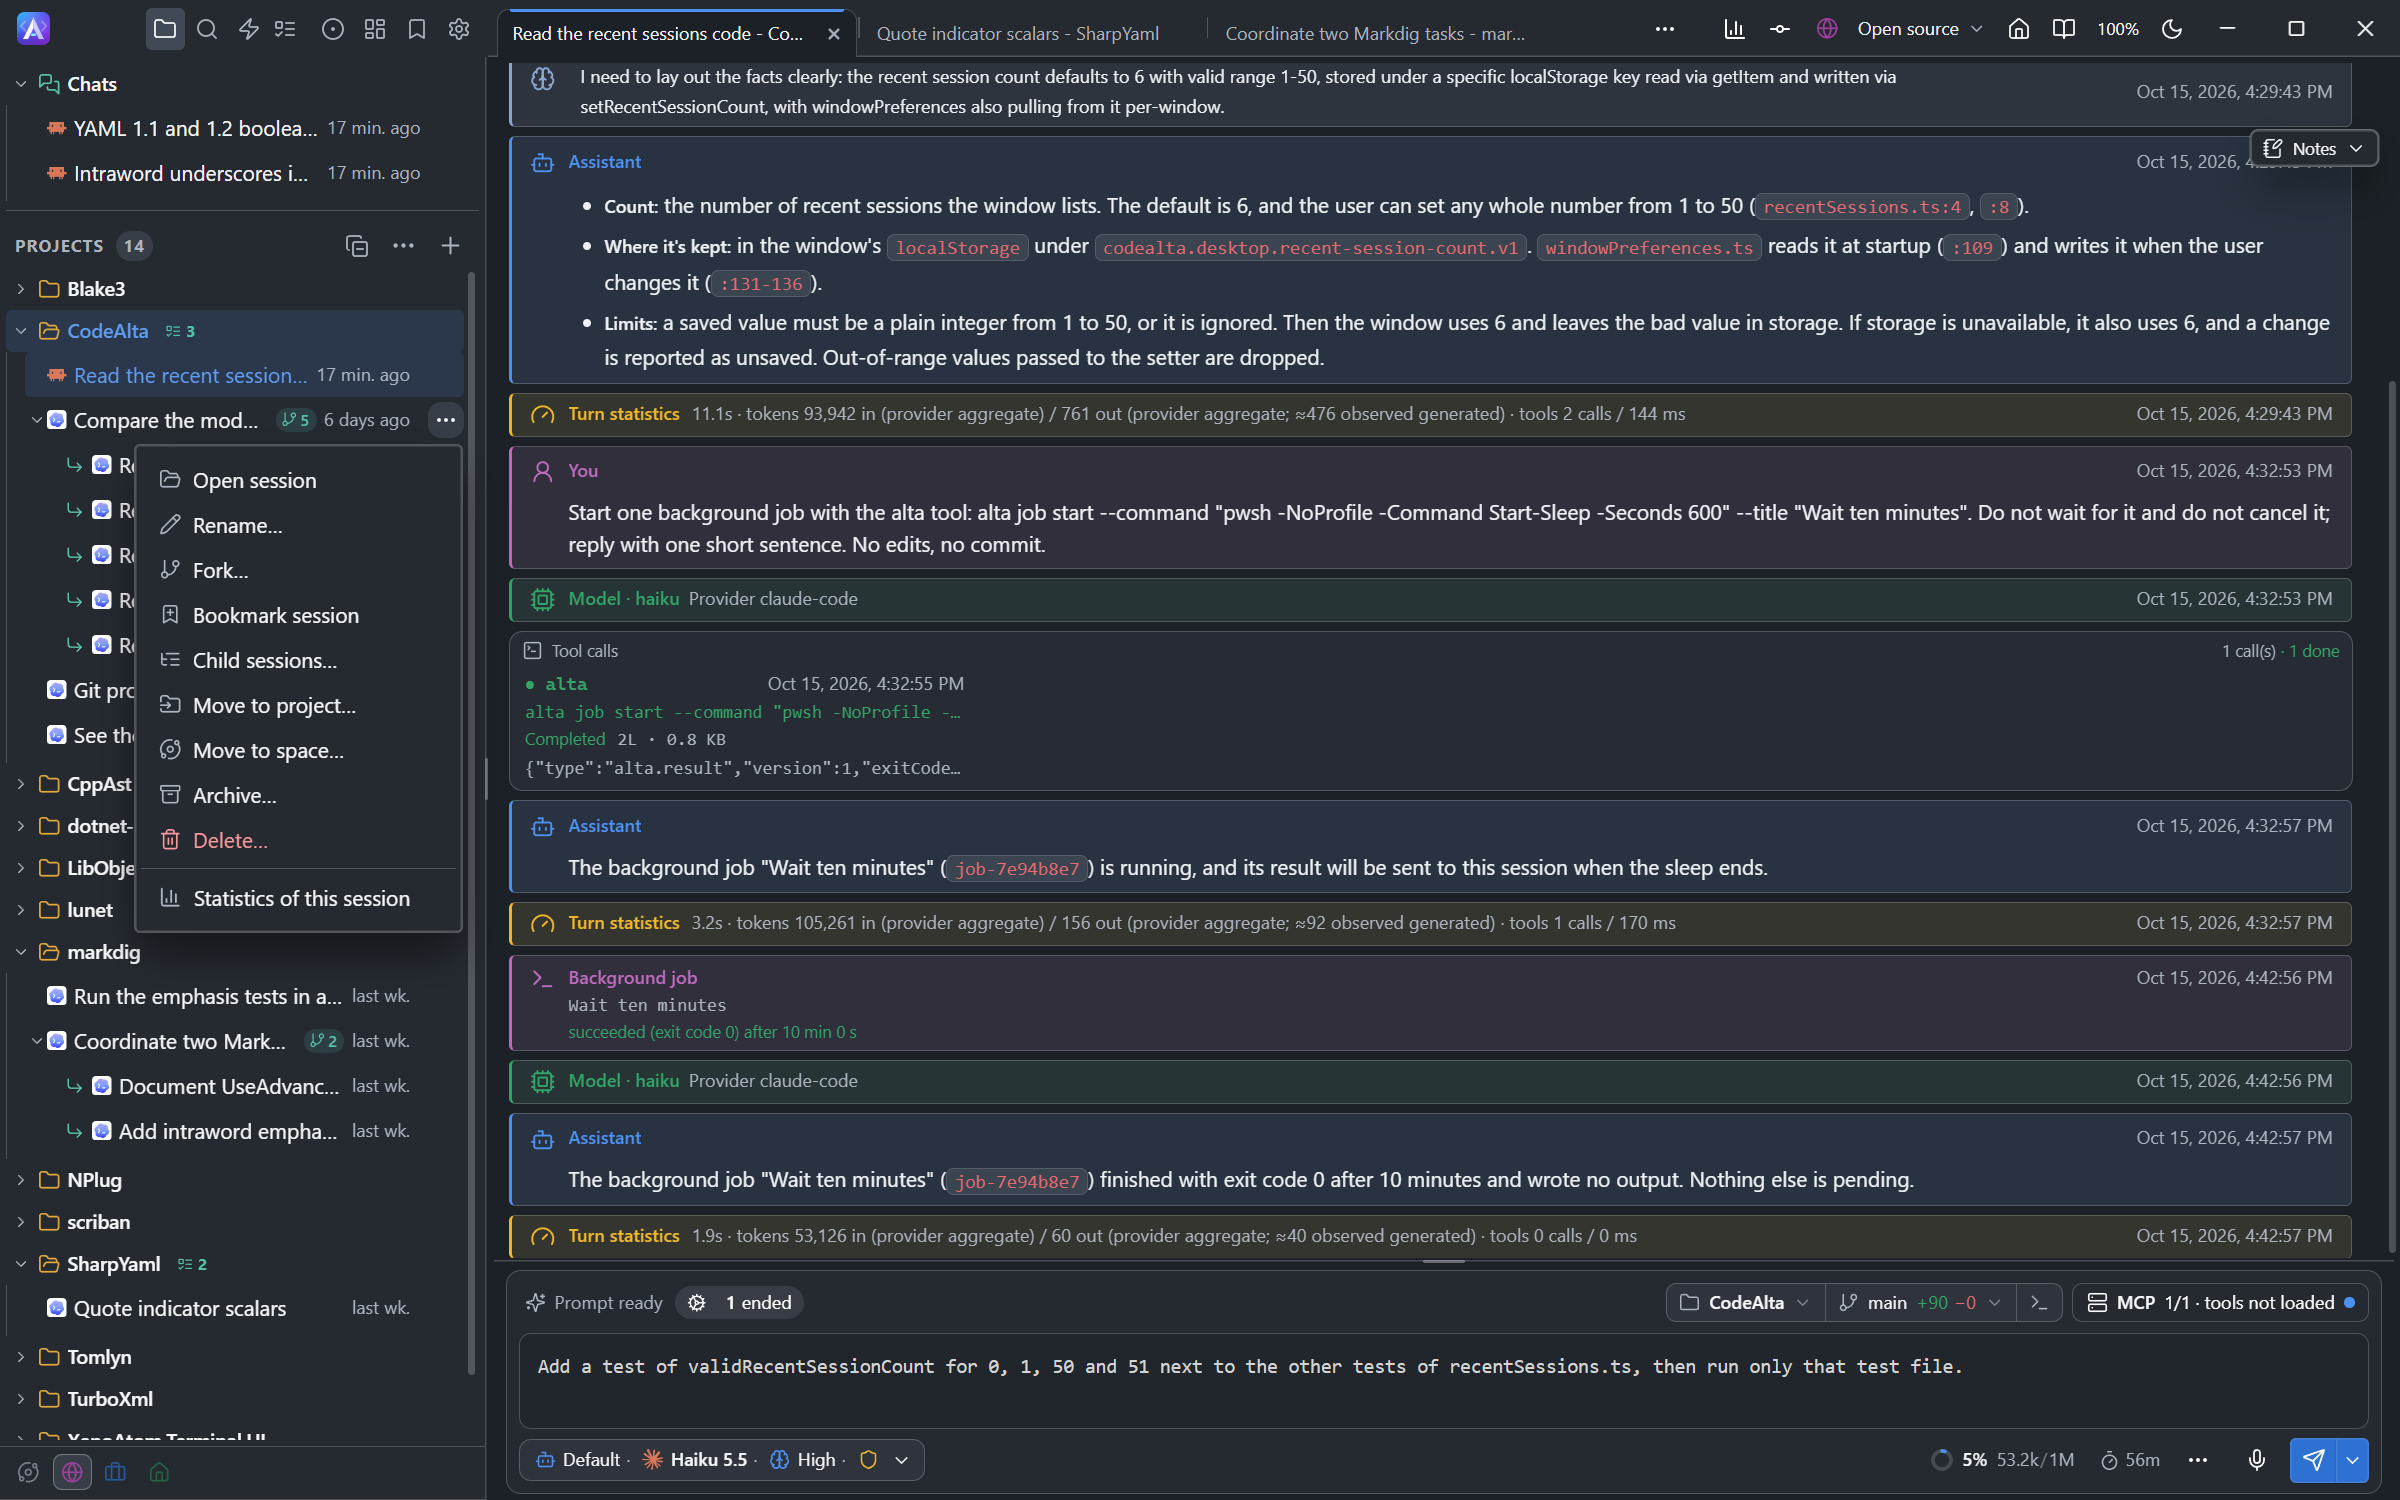
| A session | Statistics of this session in the menu of a session opens the page for that session and its sub-agents, in a tab of its own. So does Session statistics, at the foot of the details of the card of a turn |
| An agent | alta canvas open statistics |
| The welcome page | The Statistics card shows the sessions, your prompts, the tokens and the active time of the last seven days, and Open Statistics opens the page |
Each space has its own Statistics tab, which starts on the space it shows; a space counts its projects and its own chats (the sessions of no project that belong to it). CodeAlta TUI has no page: it keeps the card of each turn and the alta statistics commands.
The page of a session shows the whole life of the session, with the sessions it created. Its name is in the bar and opens the session; the filters you add narrow the session, and Reset comes back to it.
Statistics are recorded as sessions run. Open tabs refresh their numbers every 10 minutes by default, rather than after every turn. Use Refresh statistics in the toolbar to update them now, or choose Refresh every… in the Statistics menu: 1, 5, 10, 30 or 60 minutes. Each tab remembers its interval. A hidden tab catches up when you return to it; changing this setting does not slow recording.
The Overview shows Last data update above its tiles: the date and local time, including seconds, of the stored statistics update shown on the page. Reopening or refreshing the page does not change that time unless the data changed. It says Unavailable when no update time is known. The history bar separately shows whether older sessions are still being read.
The statistics of all your sessions
CodeAlta Desktop reads your sessions once, in the background, and keeps small counts: how many runs, how long they took, which models and tools were used, how many tokens, and what was changed in files. It keeps numbers, and a few names to tell them apart: providers, models, tools, and the title of each session. The text of your prompts, the answers and the tool results are never copied, a file is only counted by its extension, and of a command an agent ran only the name of its program is kept, never its arguments or a variable set before it. A session's title comes from the first sentence of its first prompt: it is kept at most 80 characters long, and a word that holds a / or a \, such as a path or an address, is left out of it. The numbers stay on your computer and are kept, with the title, after a session is deleted. Saved Statistics archives are protected from Reset and Forget deleted sessions, as described below.
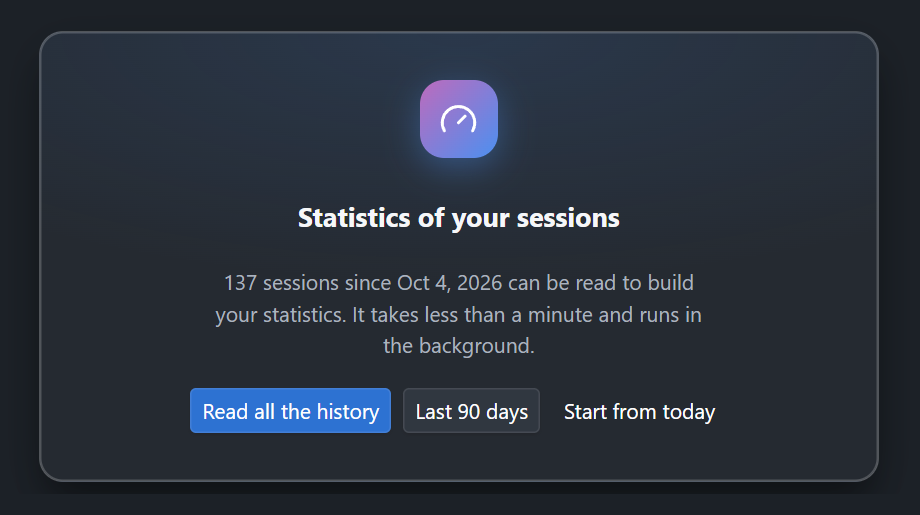
The first time, nothing is read until you choose how much of your history to use. The page says how many sessions can be read and since when, and offers:
| Choice | What happens |
|---|---|
| Read all the history | Every session is read, the most recent first. It usually takes well under a minute |
| Last 90 days | Only the sessions with activity in that time are read, and the statistics start at that day |
| Start from today | Nothing of the past is read; the statistics begin with what happens from now on |
The most recent sessions are read first, so today and this week are right within seconds, and the older days follow. The reading runs on one thread at a low priority and never slows a session. You can pause it, resume it, stop it where it is, and later read more history; a history you stopped still follows the sessions that change from the day it starts at. If CodeAlta closes meanwhile, nothing is lost: each session that was read is kept, and the reading goes on at the next start. Sessions written by CodeAlta TUI are caught up by CodeAlta Desktop, at its next start and every few minutes while it runs.
When a new version of CodeAlta computes more from your sessions, or keeps less of them, they are read again, one by one, and what you see stays until each session's new numbers are ready. A session you deleted cannot be read again: its recorded values stay as they were. Coverage reports when older saved sessions did not record a metric rather than claiming it was zero.
Saved Statistics survive Reset statistics. They are stored separately in saved_statistics_after_deleted_sessions under the instance's state folder (~/.alta/, or ~/.alta/dev/ for a developer instance). Before reset, Statistics also preserves facts it already holds for journals that have disappeared. Reset clears the reading choice and rebuilds the charts from saved facts; those charts remain available while you choose how much surviving history to read. Forget deleted sessions removes only facts that have not been saved in this durable archive. It does not erase saved Statistics, and there is no archive-purge button.
Keep this folder and the adjacent saved_statistics_after_deleted_sessions.initialized file in your backups. The file records that the archive was initialized, so losing the entire folder is detected even after restarting. If the archive is missing, damaged or cannot be written, CodeAlta refuses to reset its readable statistics or issue permission for automatic retirement until the problem is repaired; it does not silently replace the archive with an empty one. Do not remove the initialization file to bypass this protection. Turning off Statistics or choosing limited history does not authorize deletion of sessions whose complete statistics have not been verified.
The page asks you the first time and has the buttons to pause, resume and stop. You can also choose, pause or read more from a prompt, for example:
Read my statistics history for the last 90 days.
Pause the reading of my statistics history, and tell me how far it got.
The statistics page
The page shows the numbers of your sessions as dashboards, one tab for each question:
| Page | The question it answers |
|---|---|
| Overview | How much did I use CodeAlta, and on what? |
| Activity | When do I work with it, how long do runs take, and how many sessions run at once? |
| Models | Which providers, models and efforts do I use, for how many tokens, how long, and how full does their context get? |
| Cost | What did it cost, where a cost is known? |
| Tools | Which tools do agents use, how often, how long, and how often do they fail? |
| Prompts | How much do I write, and how much do agents write to each other? |
| Agents | How much work is given to sub-agents, how deep do they go, and what do automations and reminders start? |
| Code | How many files and lines changed? |
| Projects | Which projects and spaces take the work? |
| Sessions | The sessions of the period, in a table that sorts on any number and opens the session |
| Health | Errors, interrupted runs, compactions, how full the context gets |
Context fill keeps a measured 0% visible; a gap means no request reported a context window. Sessions at once says when runs with unknown timing were left out. When some parents are unknown, sub-agent depths are labelled as at least the levels shown. Depths are always counted from the top of the whole tree, even on a session's page.
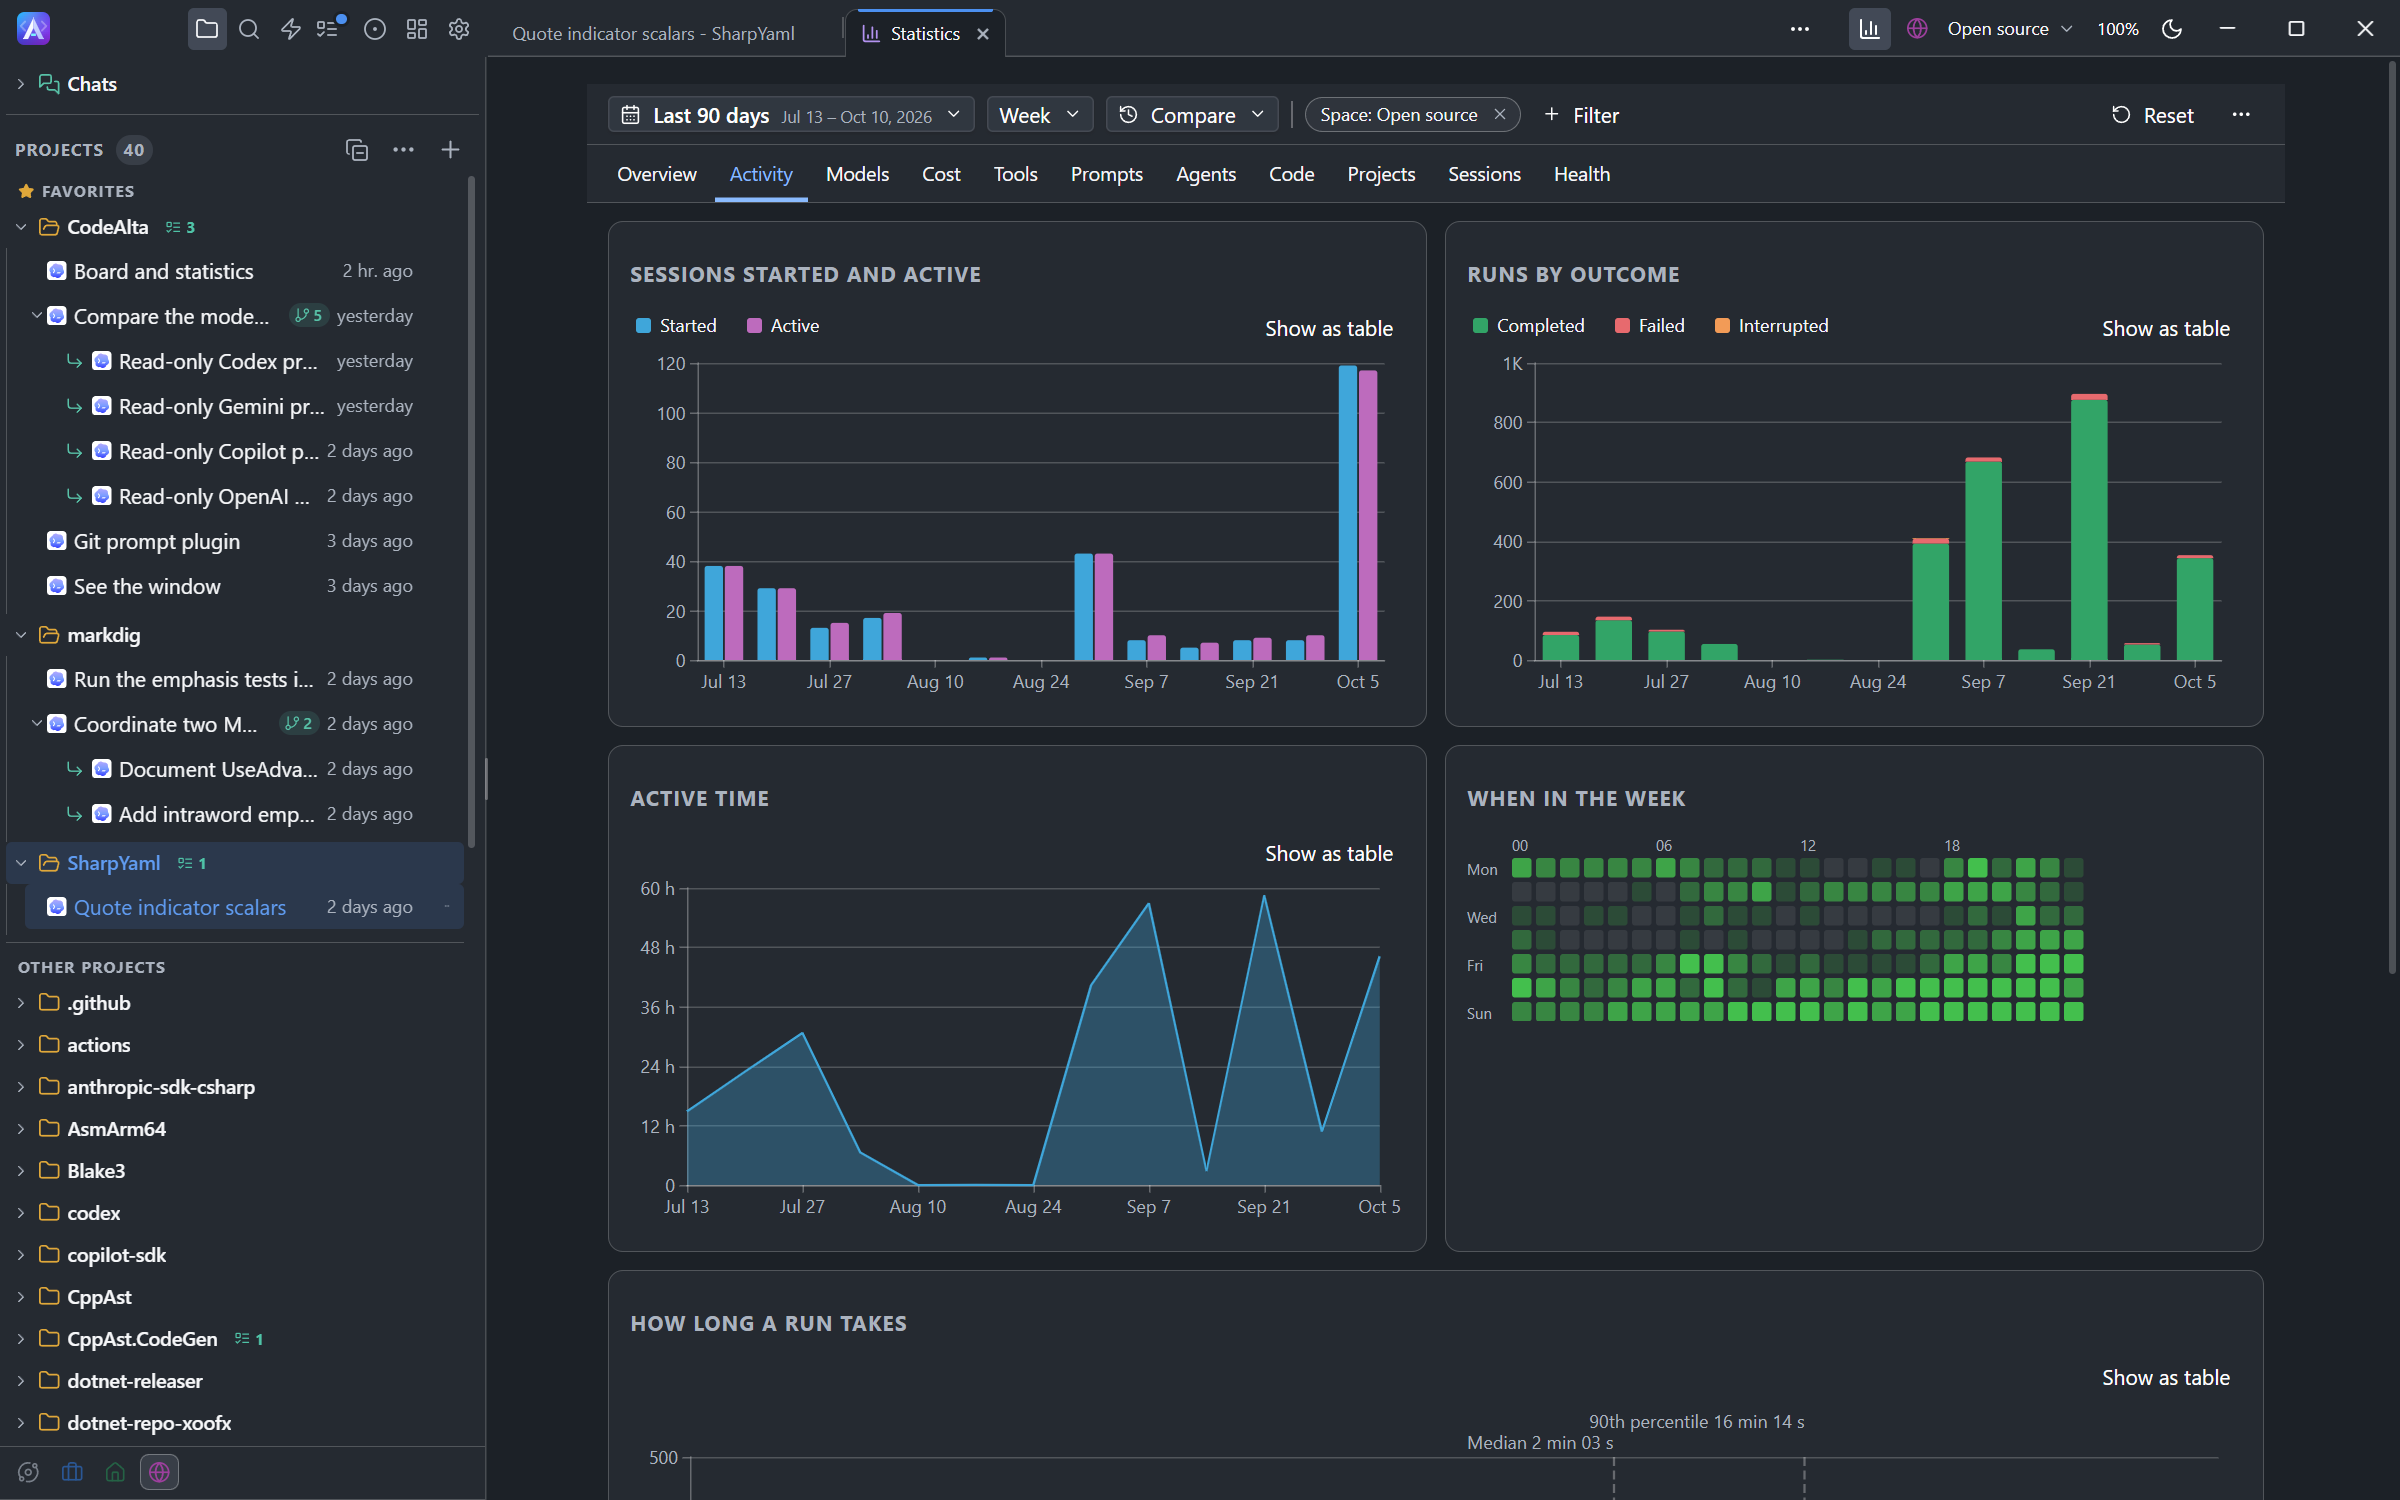
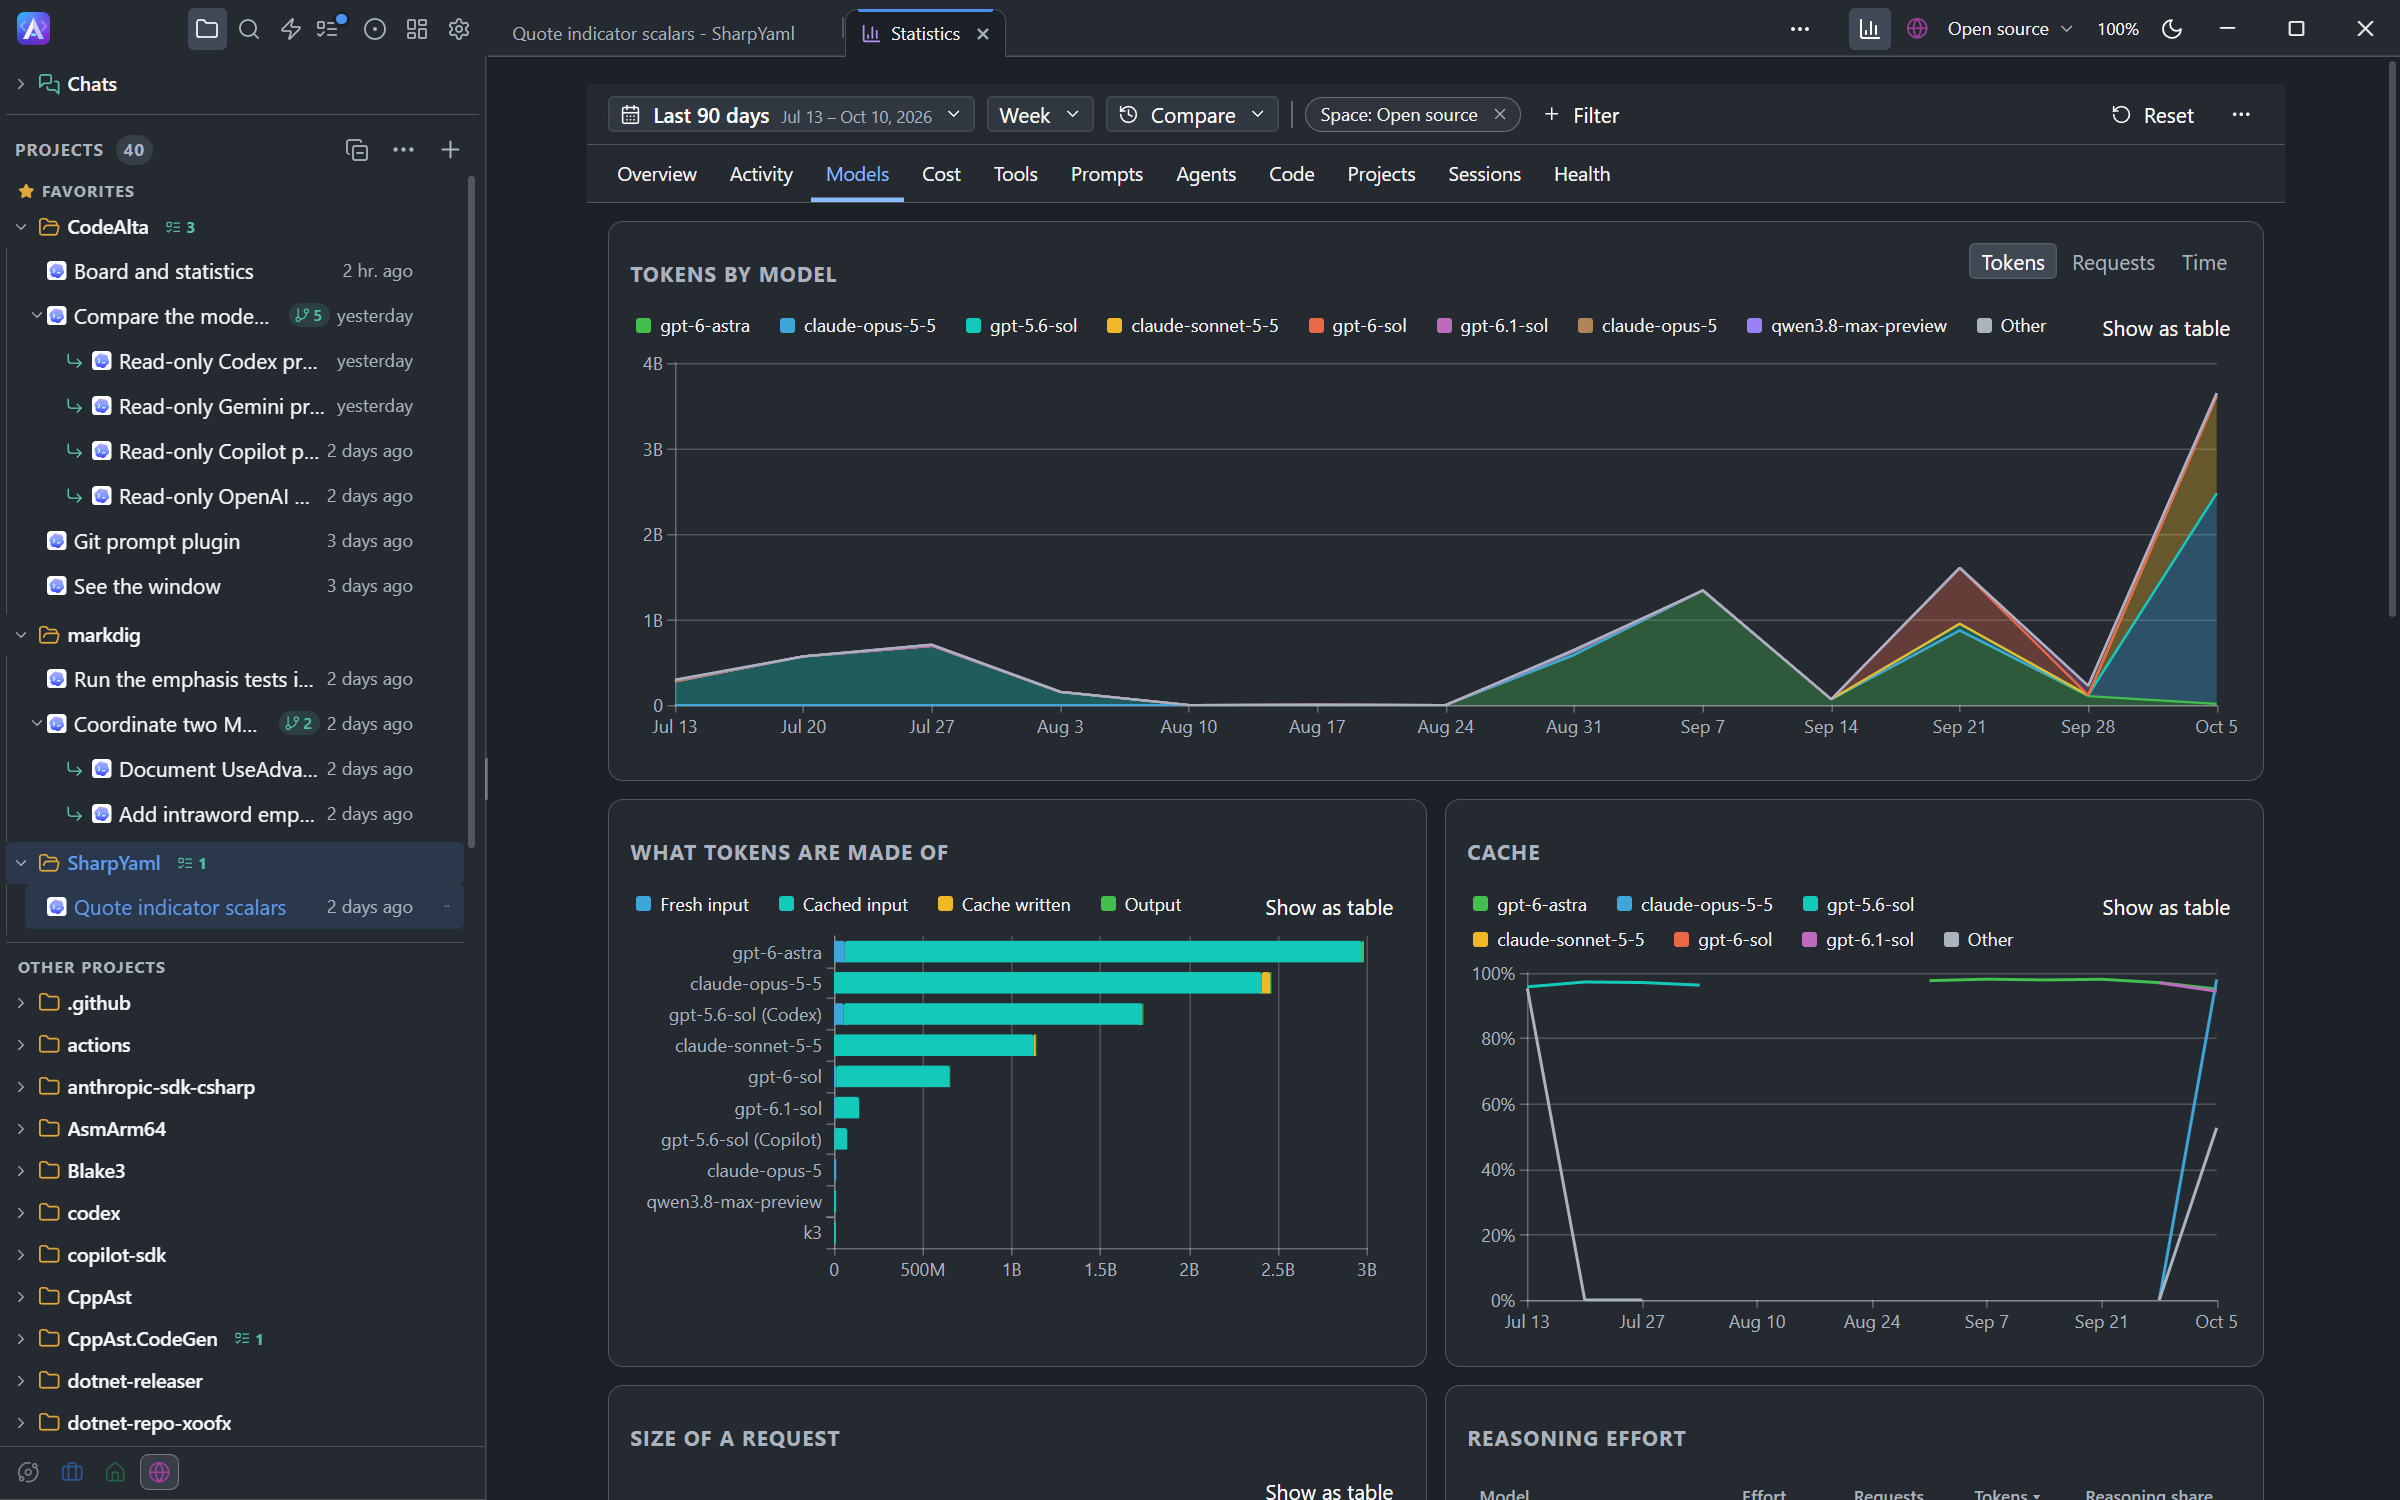
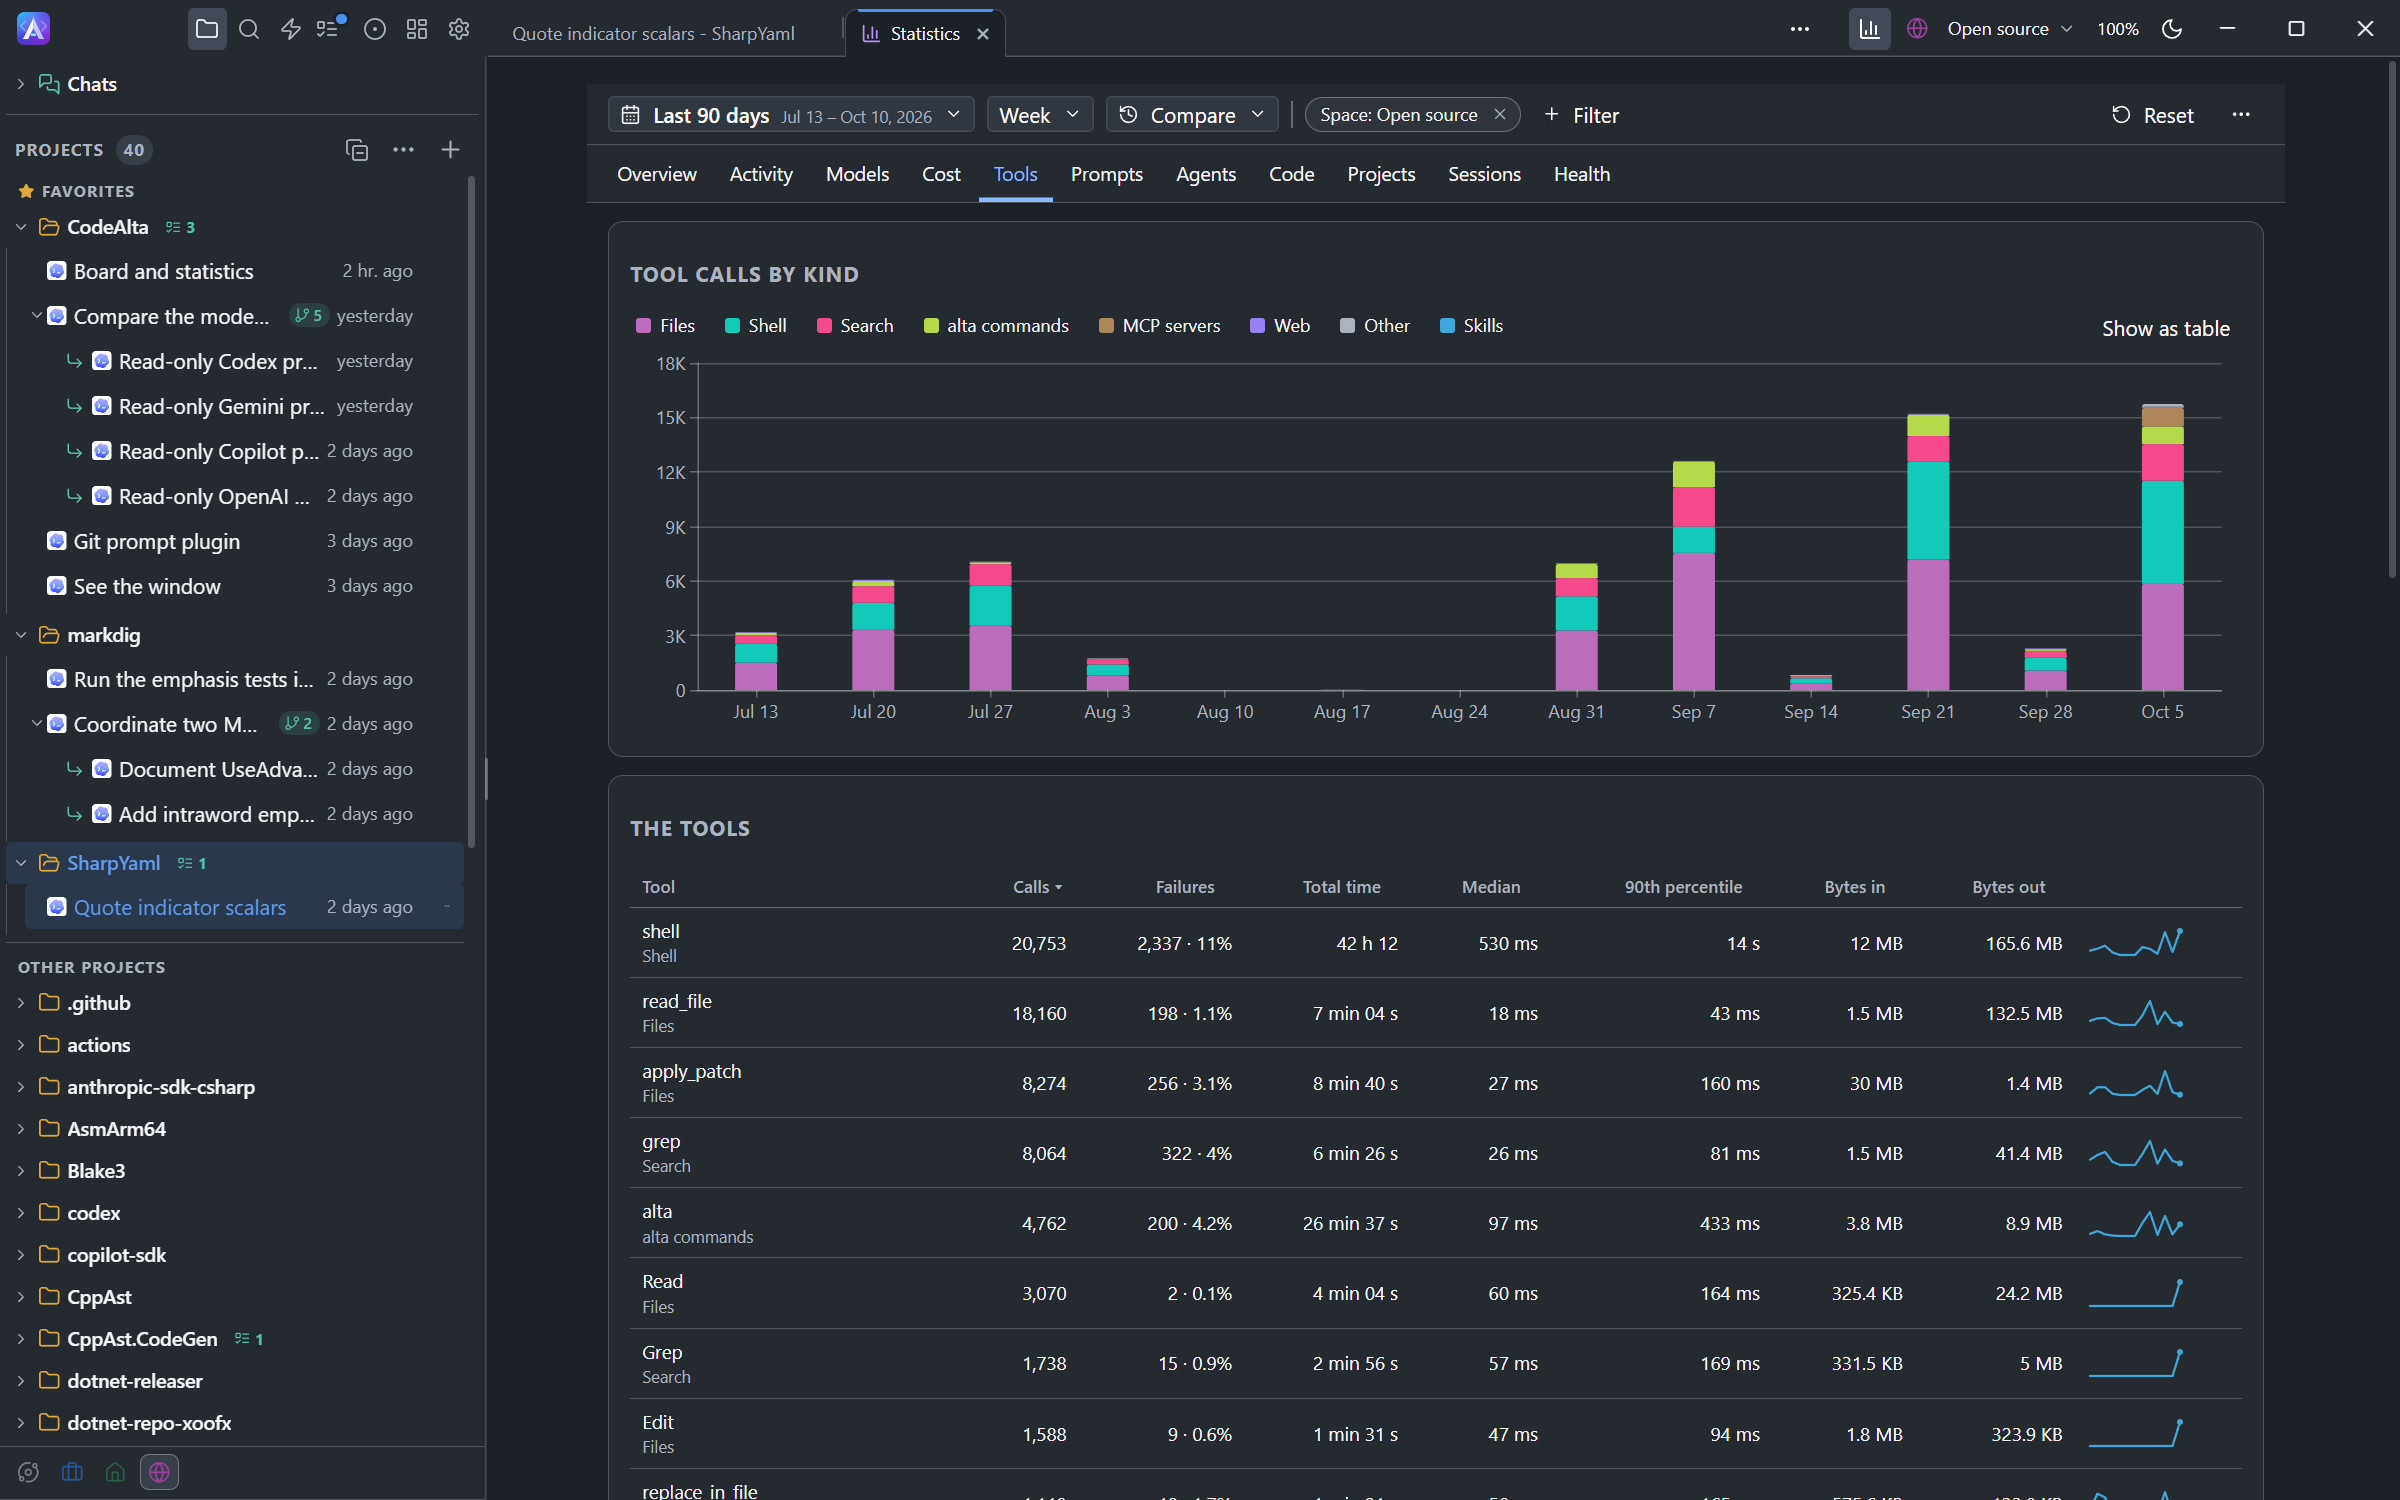
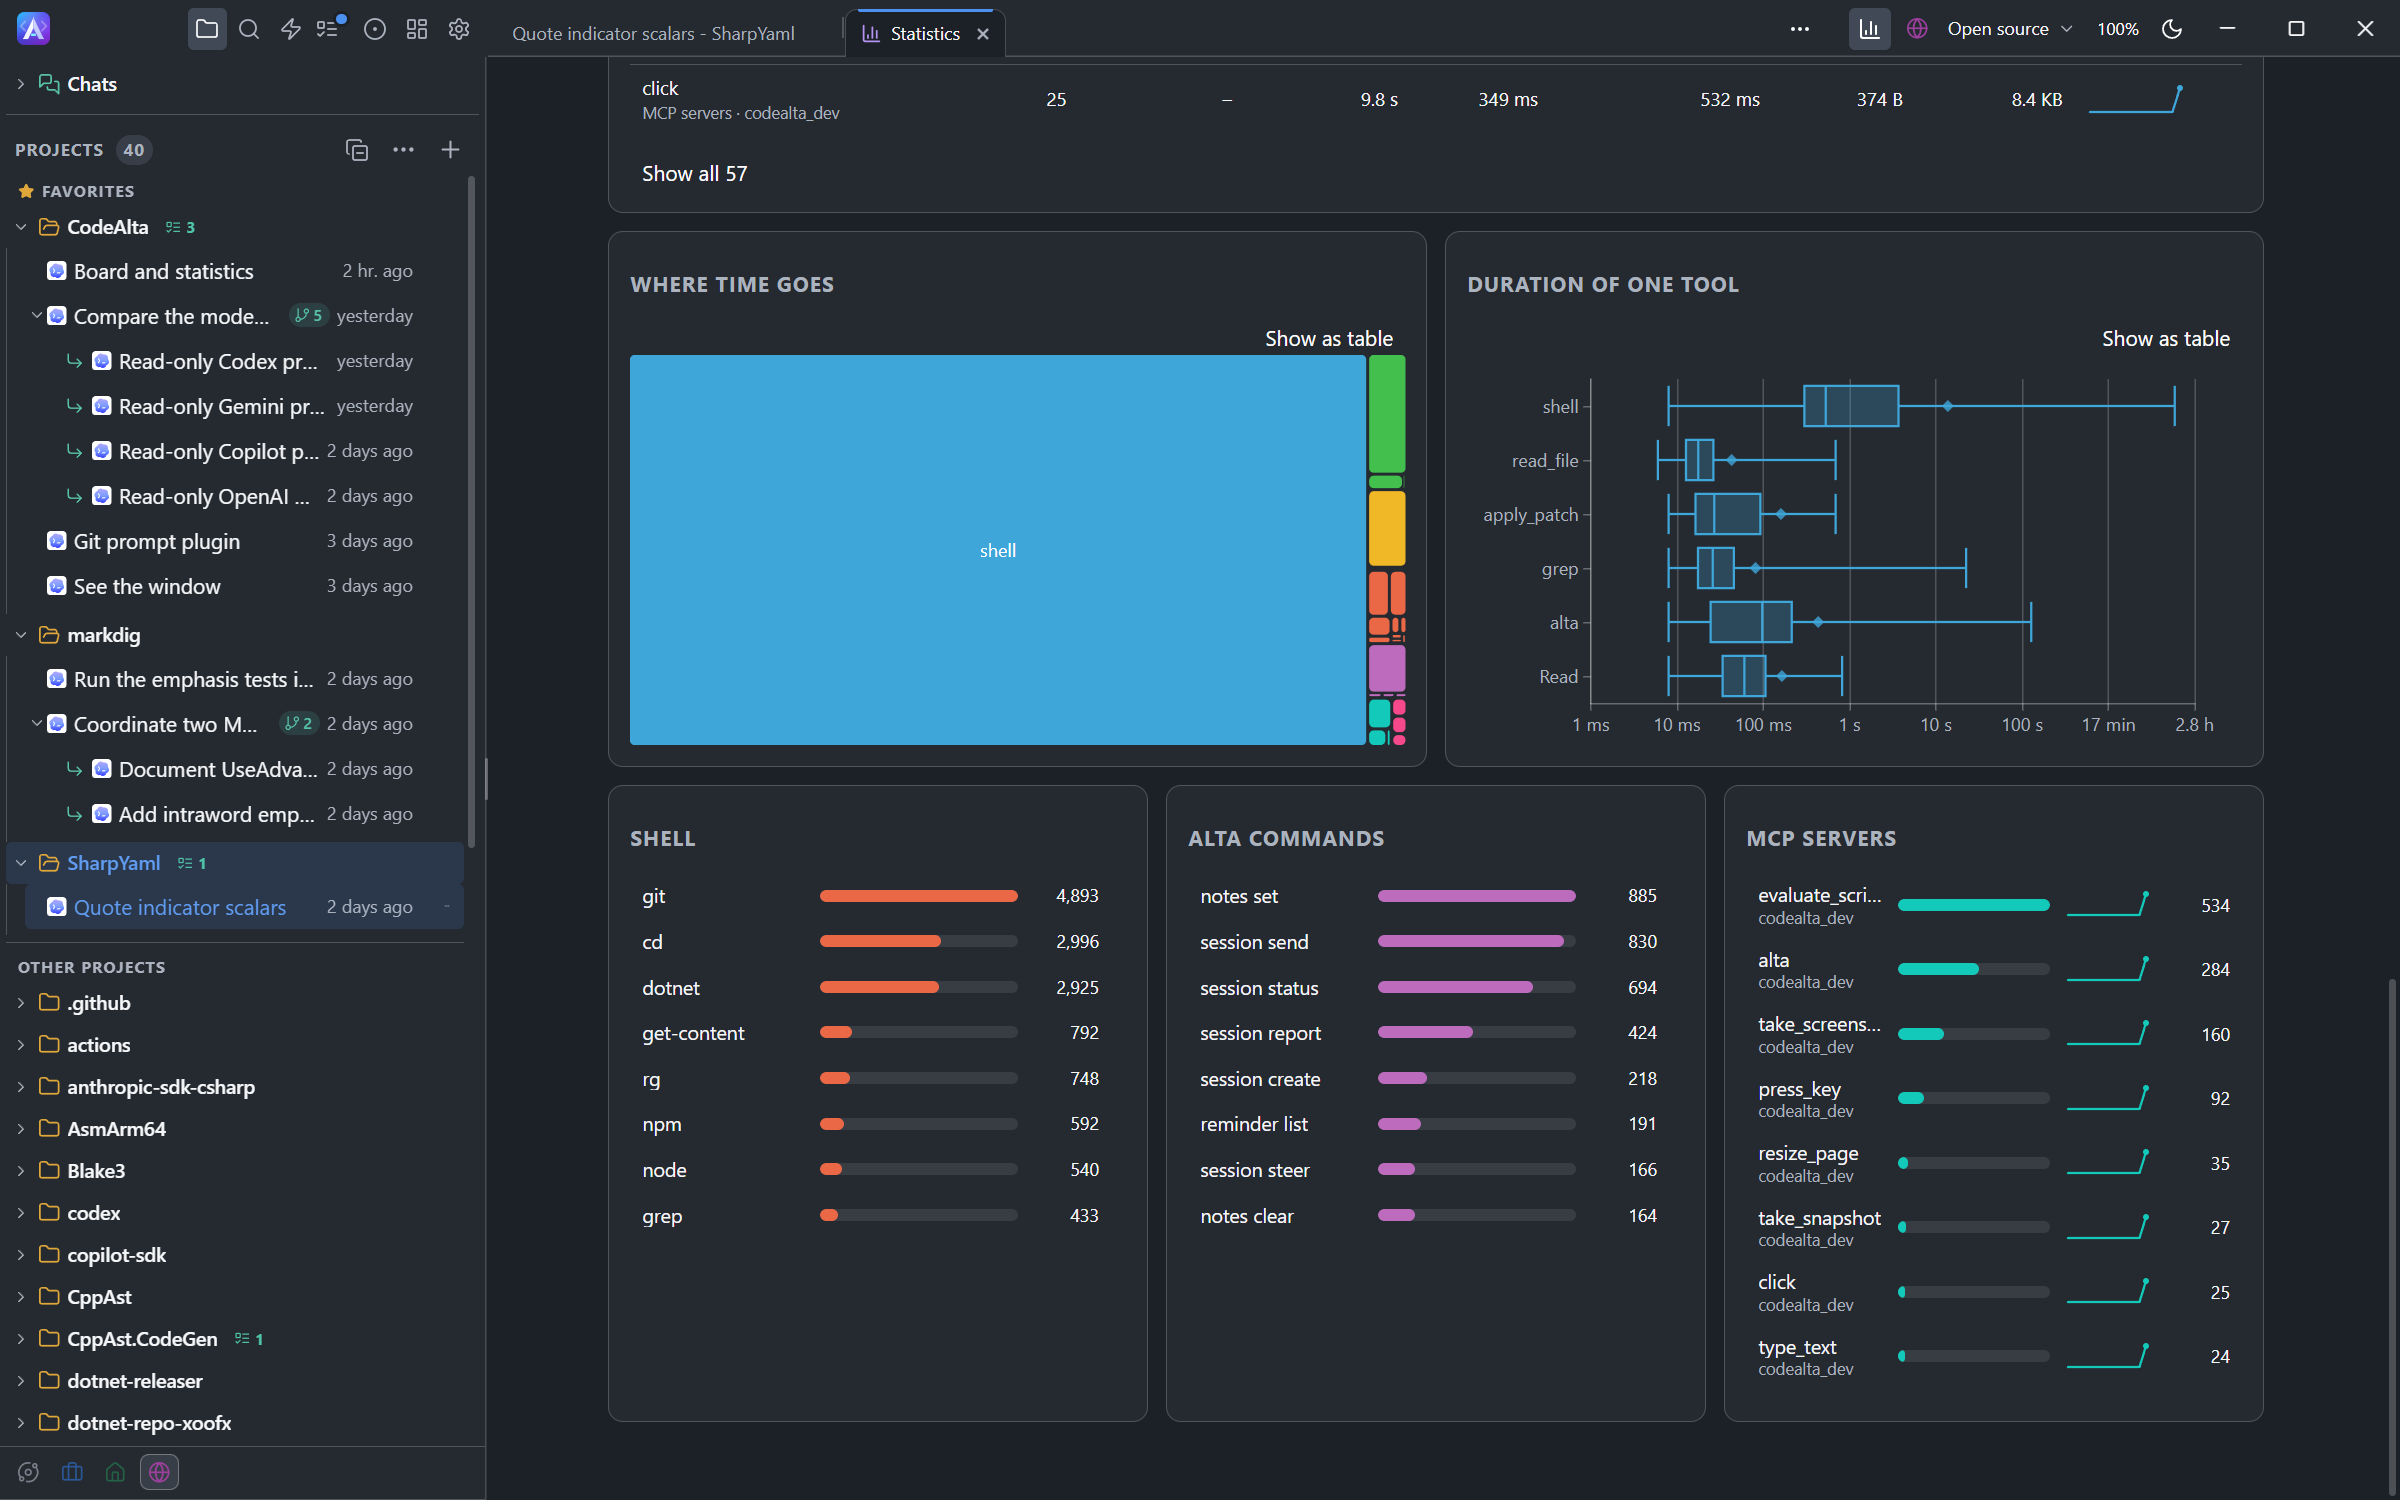
alta commands and the MCP servers.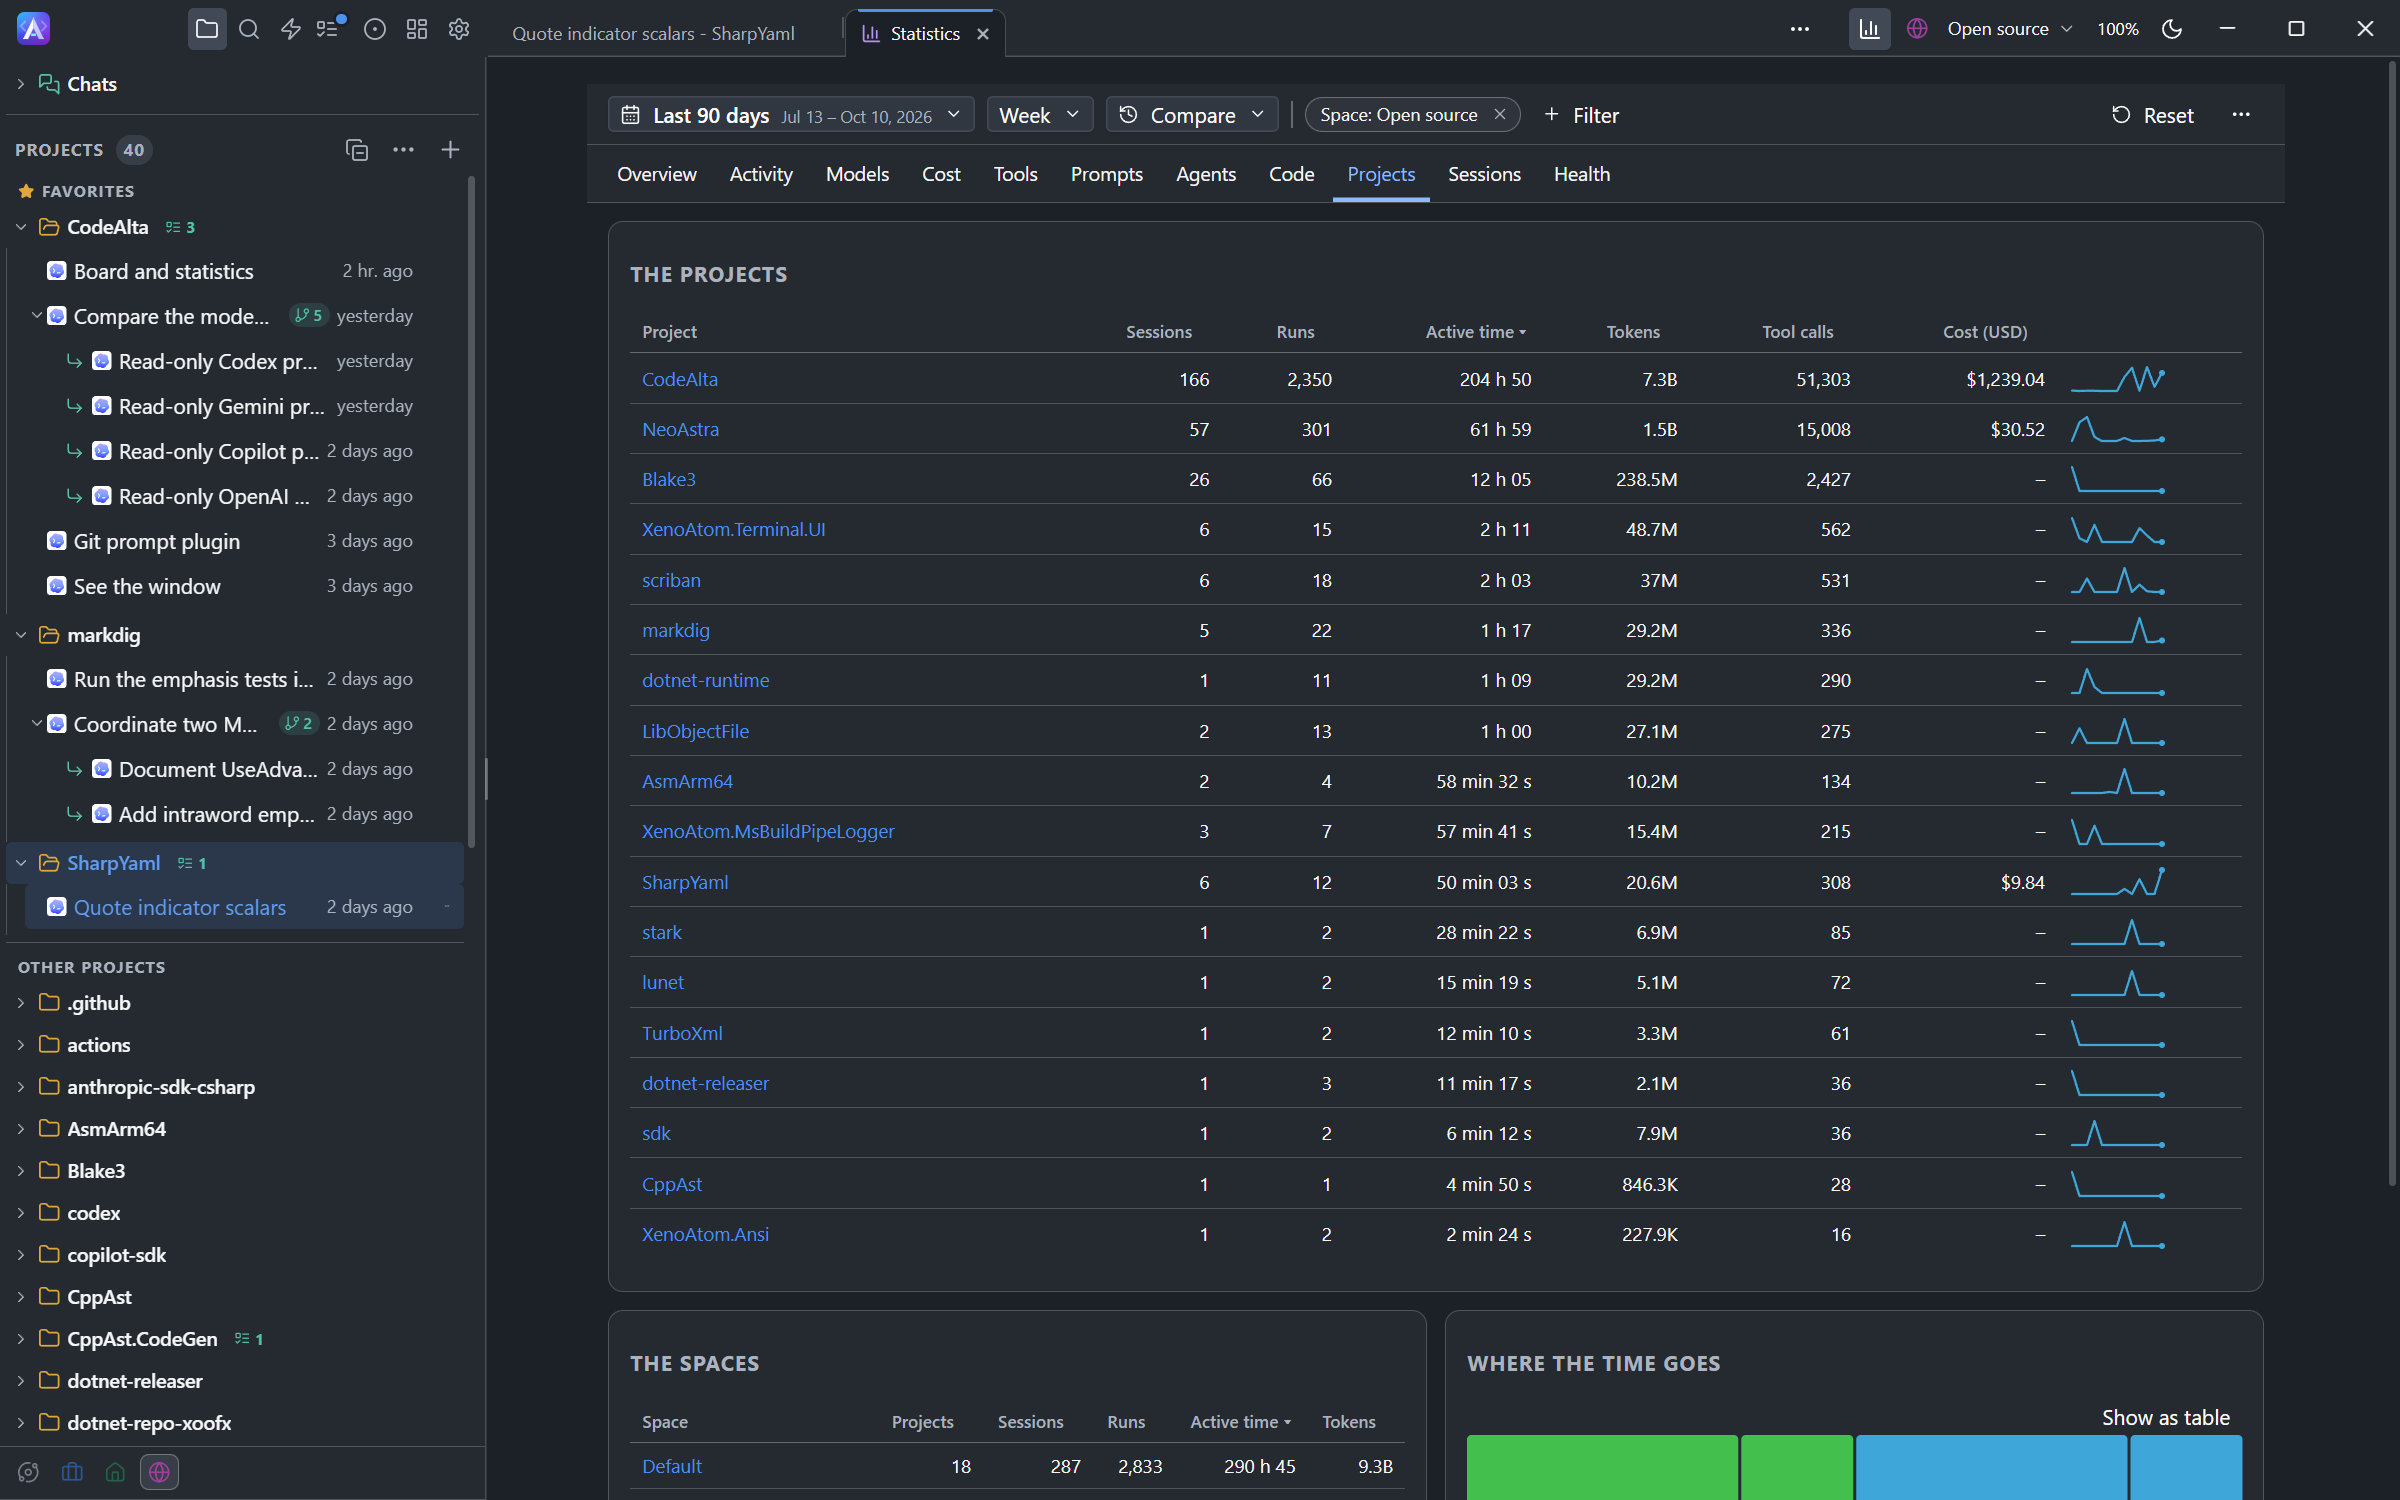
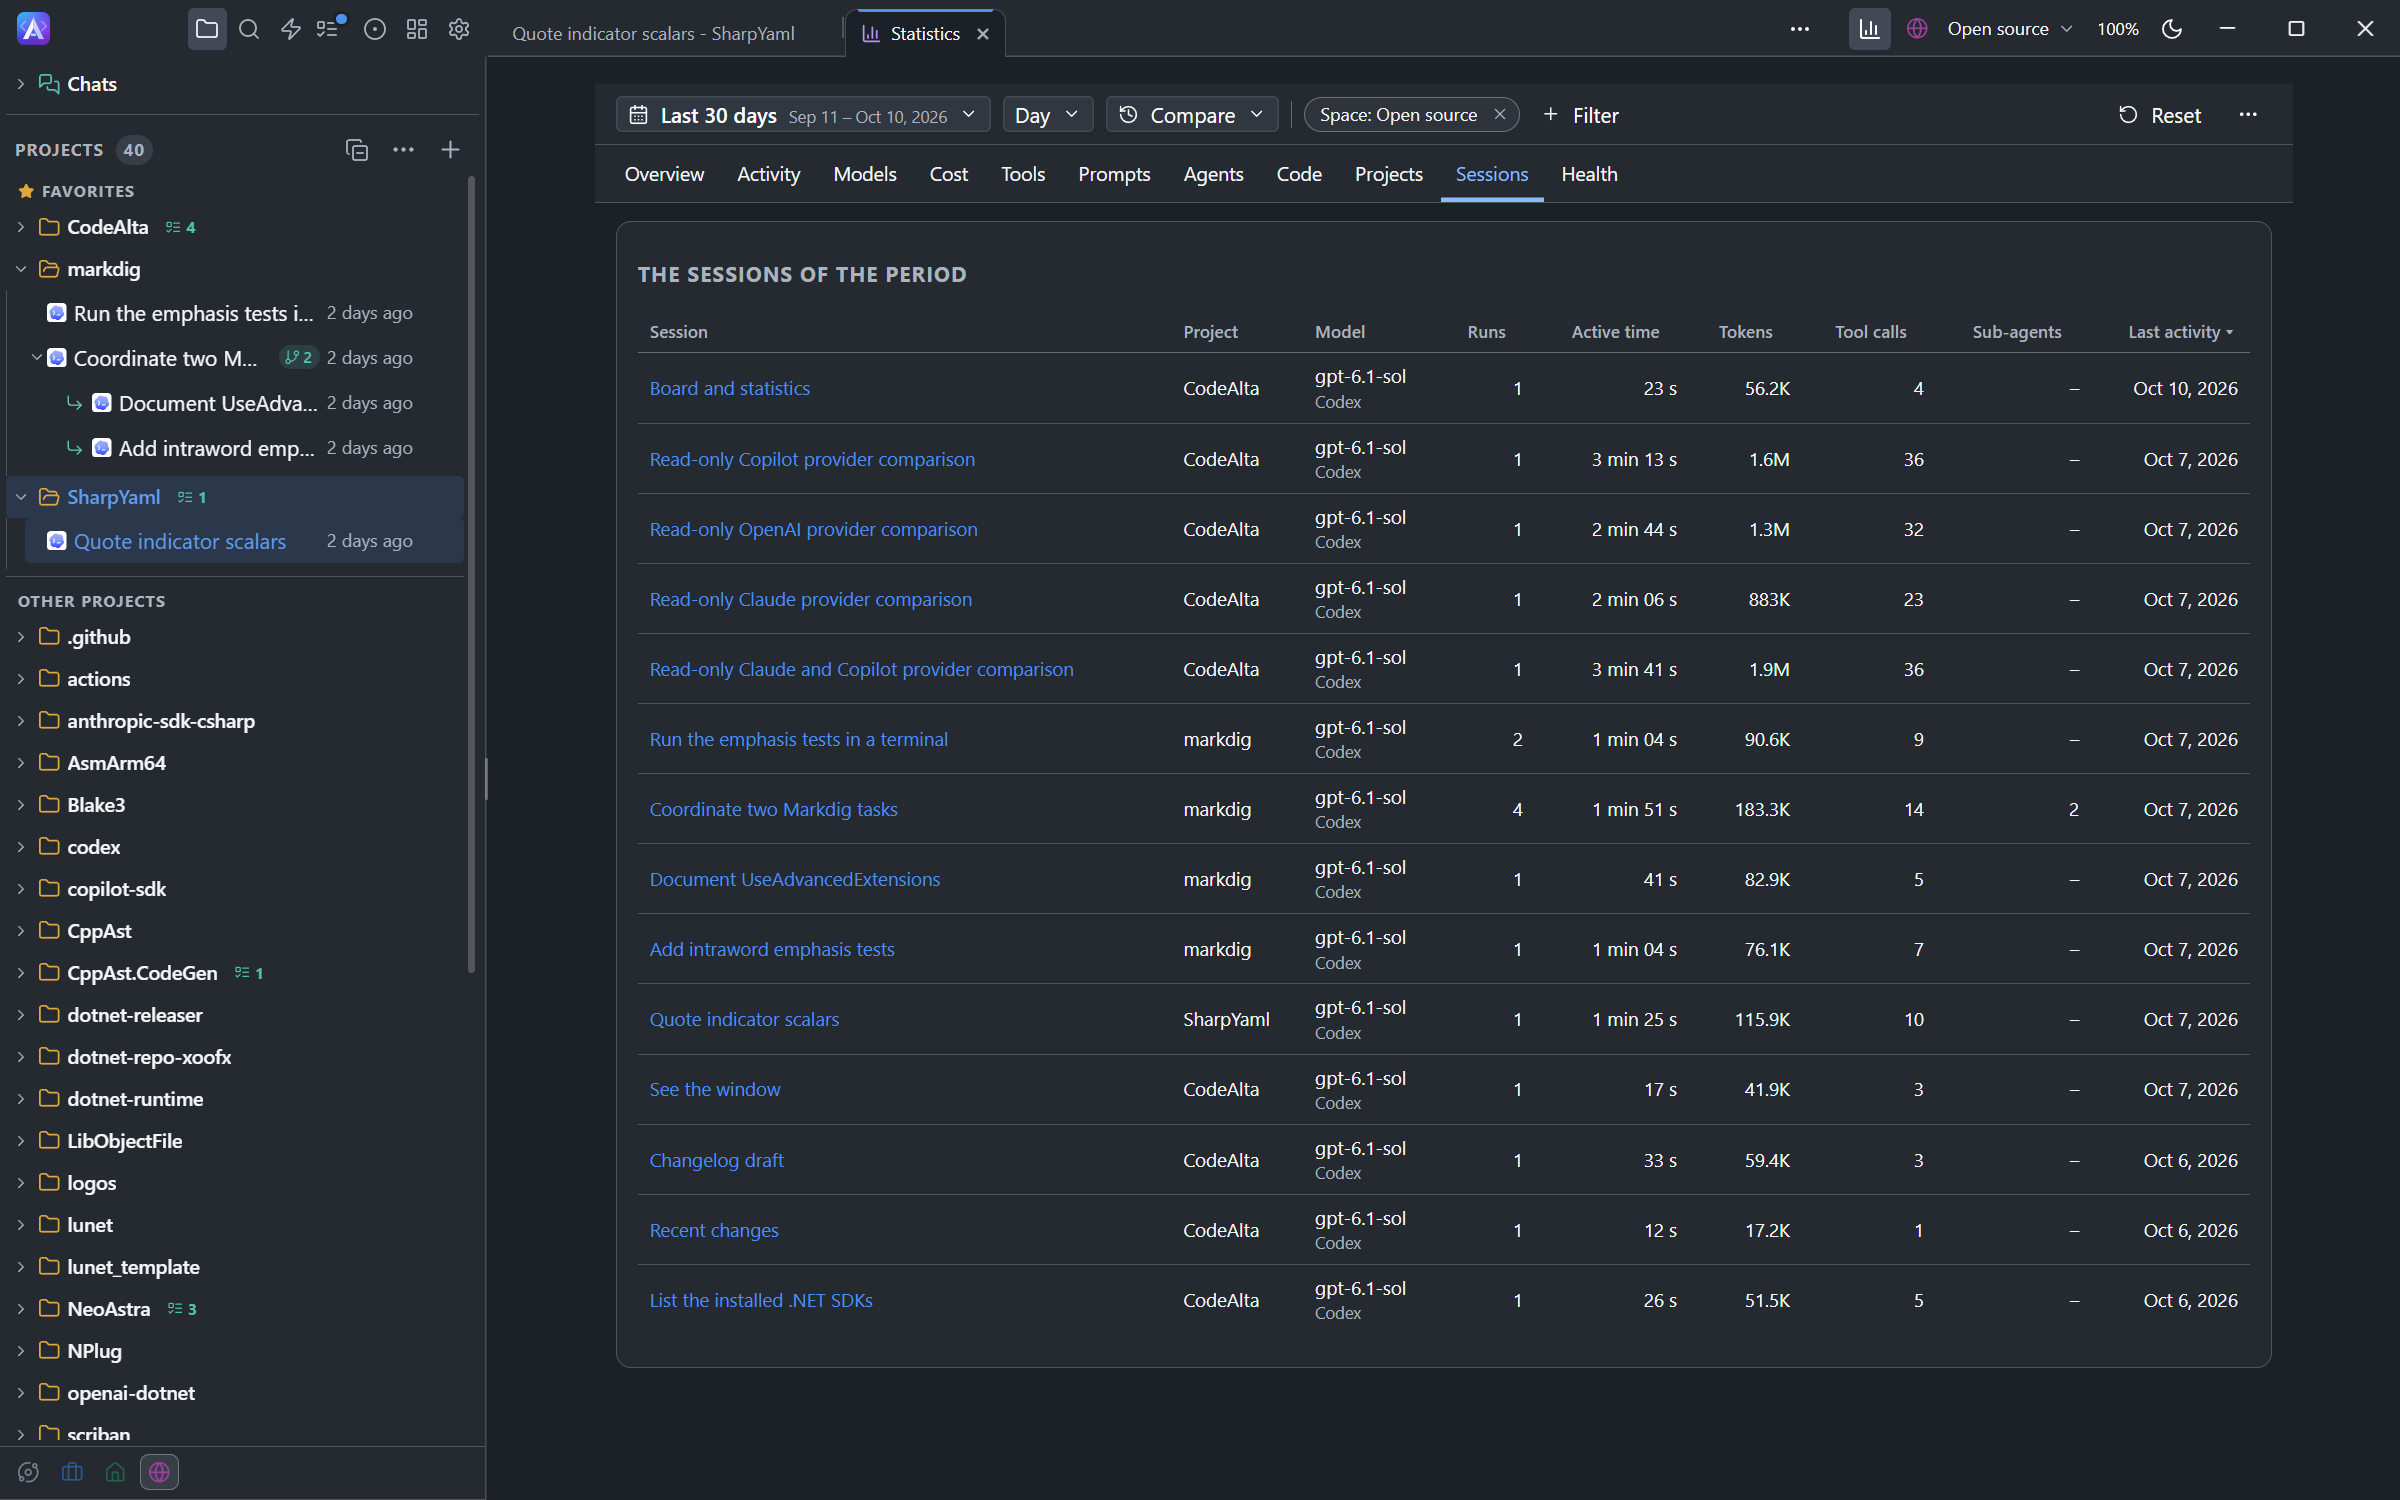
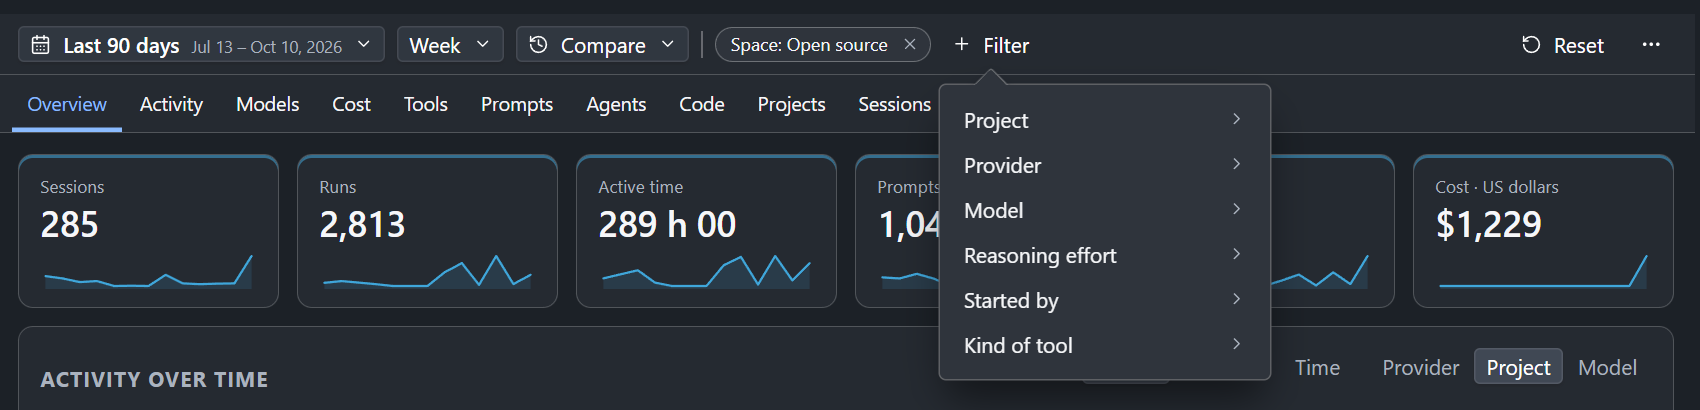
One bar at the top sets the period (today, the last 7, 30 or 90 days, this month, last month, this year, all time, or two dates), the frequency (hour, day, week, month, year, or automatic), a comparison with the period before or the same period a year before, and the filters: space, project, provider, model, reasoning effort, who started the work and the kind of tool. A click on a bar, a legend entry or a row adds the filter, a click on a day of the calendar shows that day, and a drag on the strip under the main chart narrows the period. The page opens on the space the window shows, and removing the filter shows every space.
Every chart can be shown as a table with the same numbers, and the legends and menus work with the keyboard. A cost is shown for each unit, dollars or AI credits, never as one total, and an estimate from public prices, when it is offered, is a separate block marked as an estimate. The page follows the theme of the window.
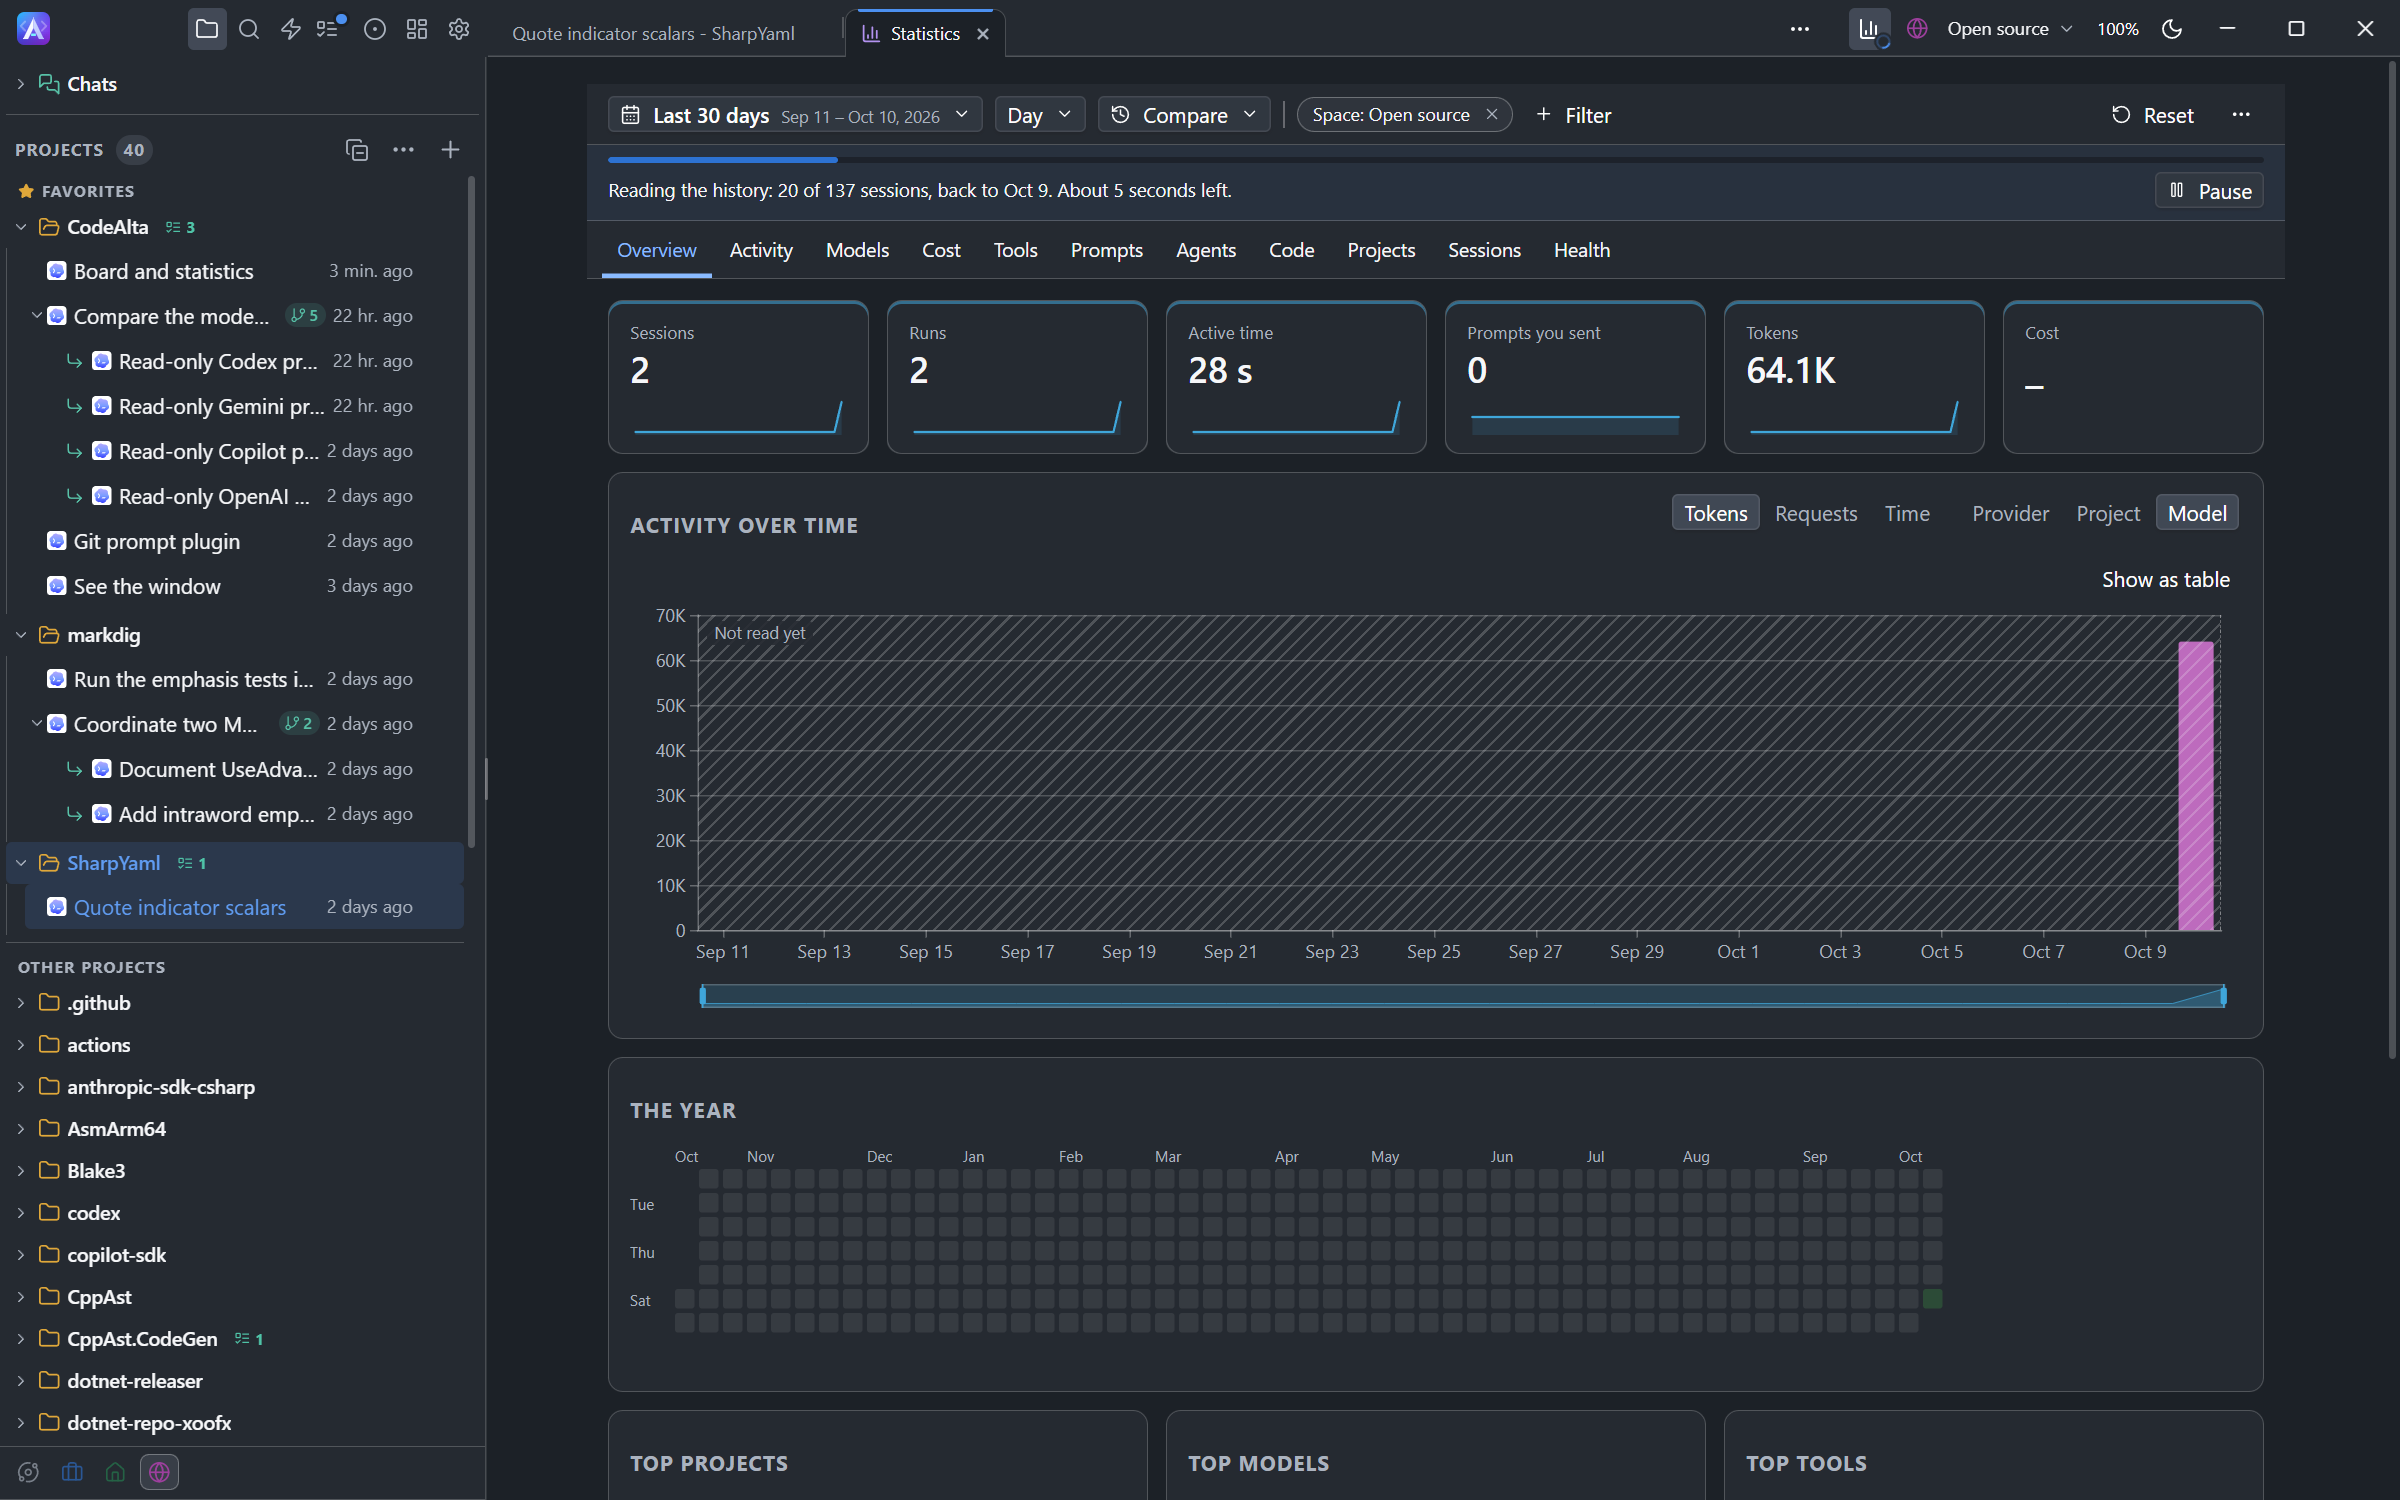
While the history is read, the page is already in use: the most recent days are right first, the part not read yet is hatched, and a bar under the controls shows how many sessions are read, the date reached and the time left, with Pause, Resume and Stop here. The menu of the page reads more history, forgets the sessions that were deleted, and resets the statistics after asking.
Ask for the numbers
Agents read the numbers with the alta statistics commands. Ask in a prompt; the answer comes from the same numbers every page of CodeAlta uses:
How much did I use CodeAlta this week compared with the week before? Give the tokens and the active time.
Which tools take the most time in the CodeAlta project over the last 30 days?
Show my tokens per week for the last 90 days, by model.
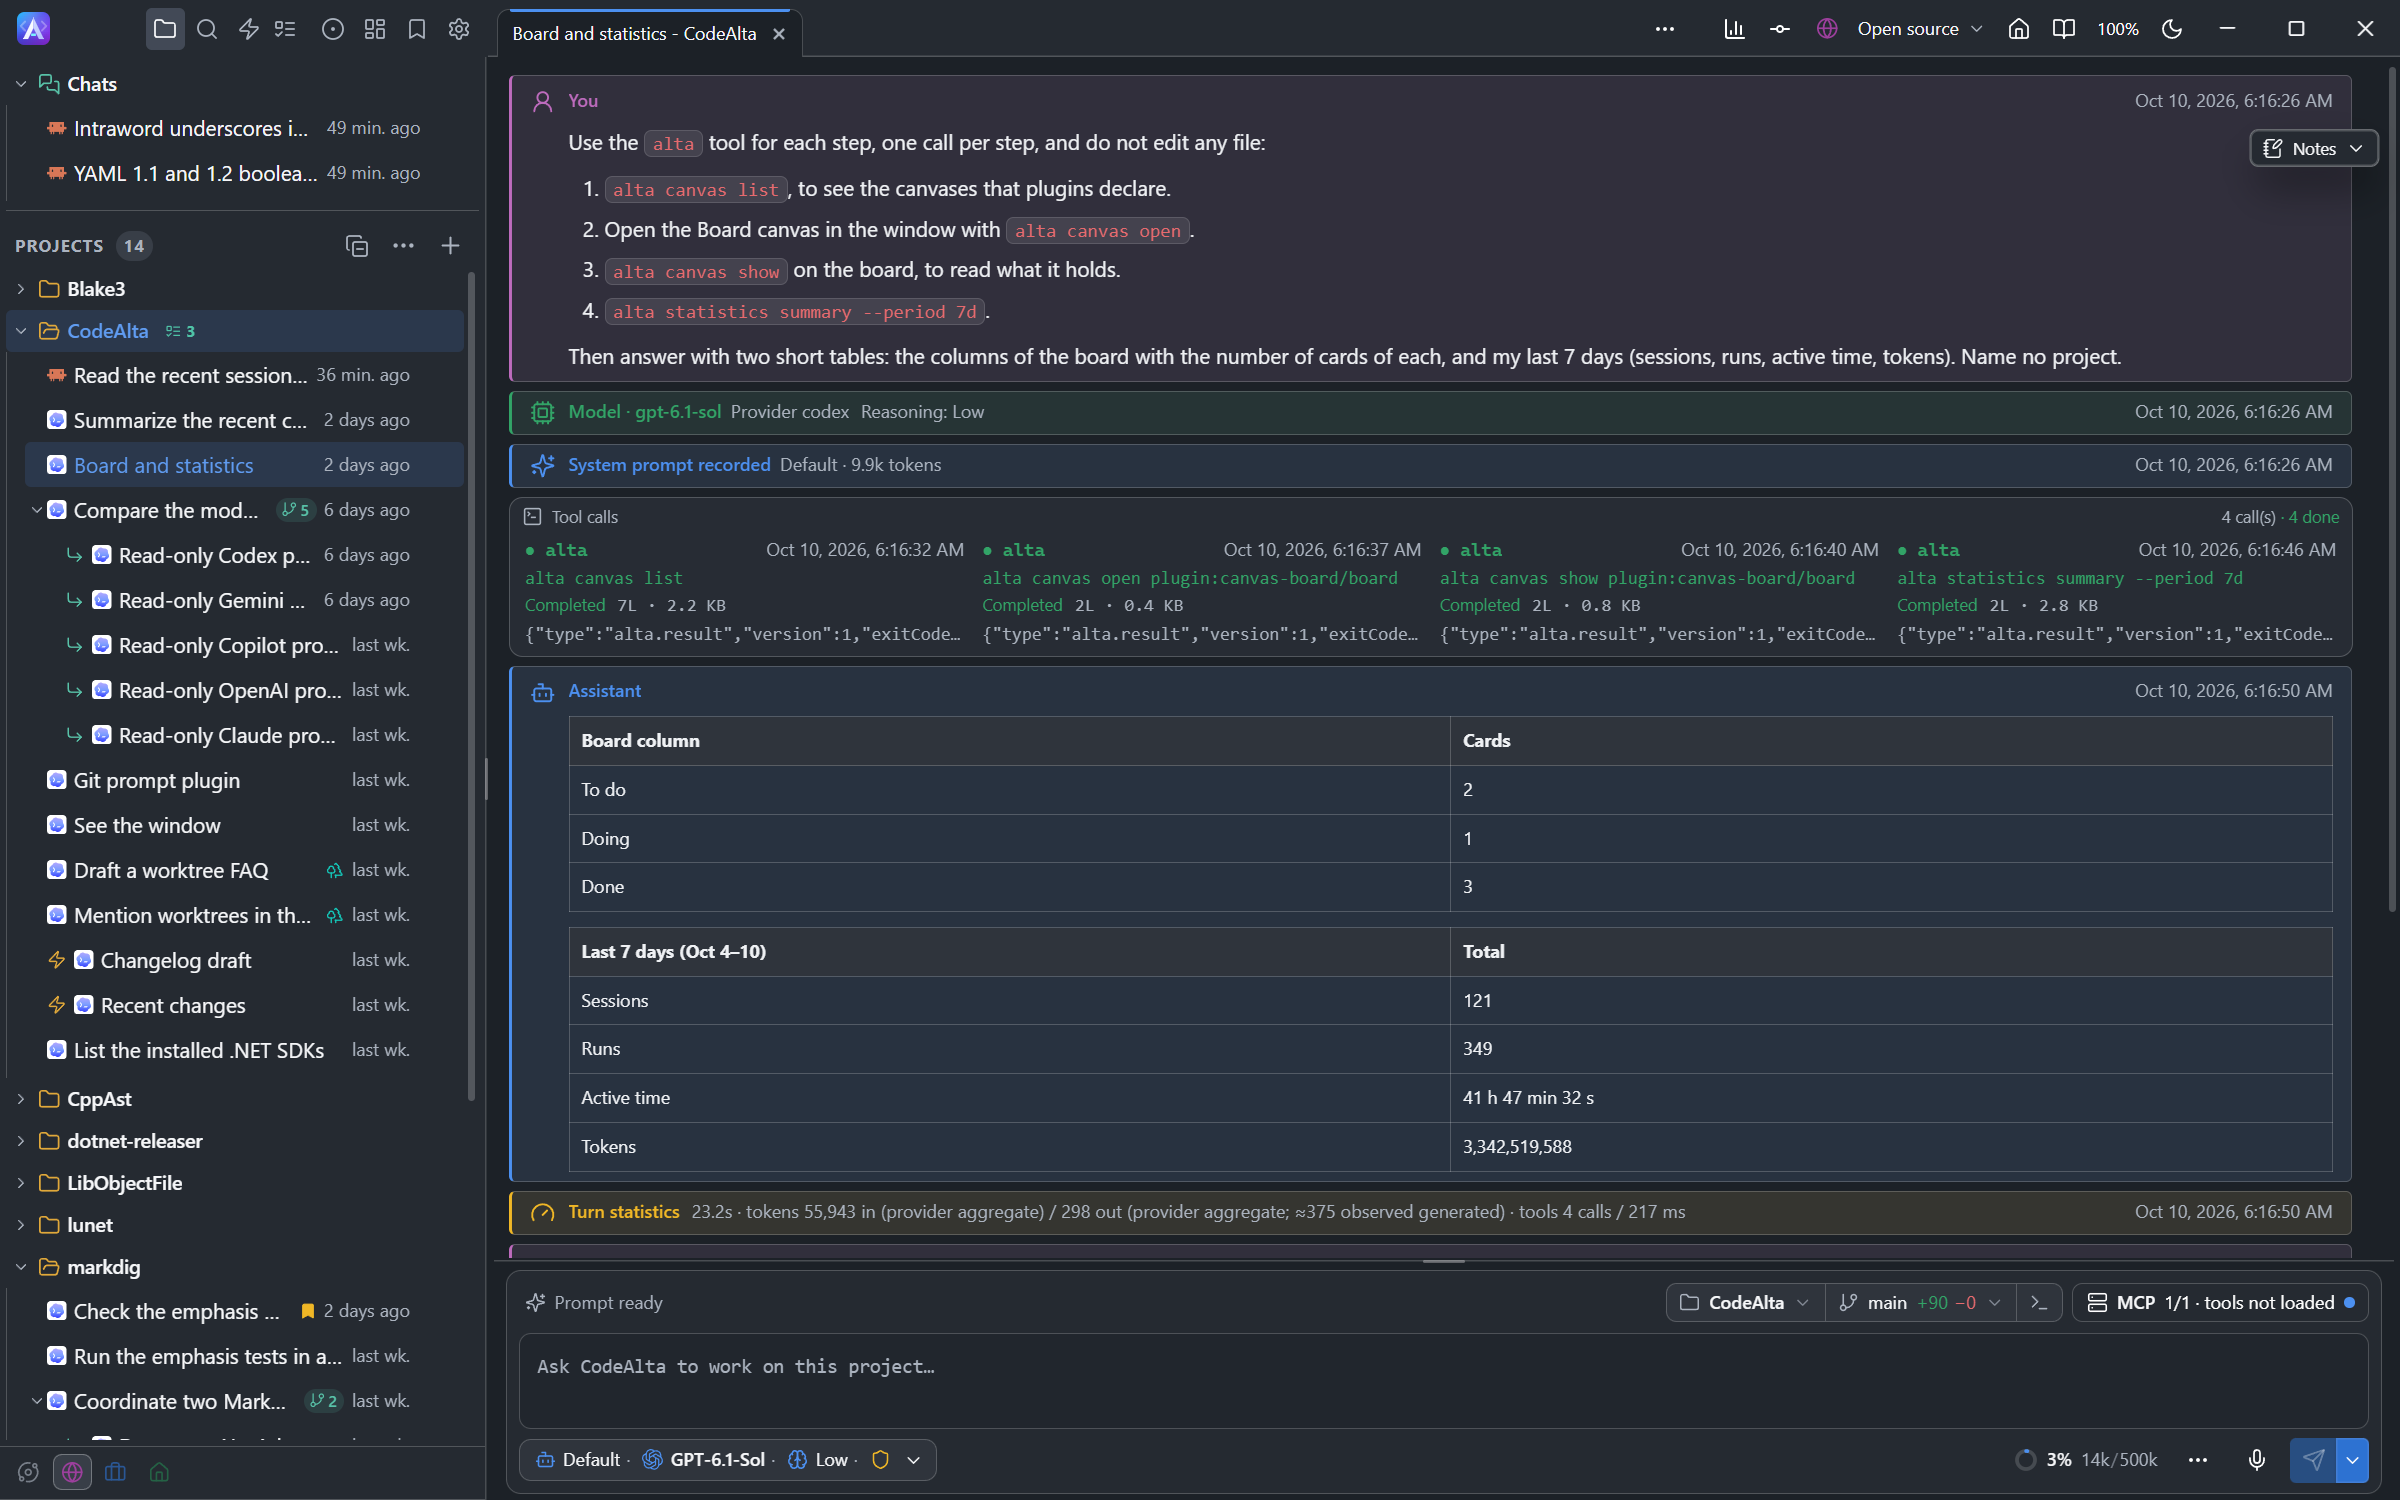
alta, and answers with the numbers.| Command | What it answers |
|---|---|
alta statistics summary |
The numbers of a period at a glance, with the change against the period before |
alta statistics series <metric> |
One metric over time, by hour, day, week, month or year, optionally by provider, model, project or tool. Among them sessions-at-once, the most sessions with a run going at the same moment, and context-fill, the average fill of the context window |
alta statistics top <tools\|models\|projects\|sessions> |
A ranking by tokens, time or calls |
alta statistics details <list> |
The programs of the shell commands agents ran, the commands of alta they called, the kinds of files they changed, and how deep the sub-agents go (sub-agent-depth) |
alta statistics session <session> |
The numbers of one session, with its sub-agents when asked. --session <session> on summary, series, top and details gives the same session over a period, with --with-children for its sub-agents |
alta statistics status |
Whether the history is read, how far, and what is left |
alta statistics history ... |
Choose how much history to read, pause, resume, stop, or forget the sessions that were deleted |
alta statistics estimate <text> |
The size of a text in bytes and approximate tokens |
A period is today, yesterday, any number of days such as 7d, 30d or 90d (the last days, today included), week, month, last-month, year, all, or two dates. Days are your local days, in your time zone, and a week starts on the first day of the week of your computer's regional settings, on the page and in the commands. A cost is given for each unit, dollars or AI credits, and is never added across units: only some providers report a cost. A space filter uses the projects the space has today.
Three of these numbers are read from what your sessions recorded, and say what was seen. A run counts as going from its first to its last record, which includes the time it waits for you, so the sessions at once are the sessions that had a run open at the same moment. The fill of the context is an average over the requests whose provider reports the size of the window. The depth of a sub-agent follows its parent sessions as far as CodeAlta has read them.
Every answer says whether the history is read for the period, so an agent can tell you that the numbers before a day are not complete yet. For the broader model of agent commands, see Advanced Agent Workflows.
Disable it
Disable the statistics, the cards and the commands with:
[plugins.statistics]
enabled = false
Nothing is read or updated while the plugin is disabled. The numbers that were kept stay in the database, and the plugin picks them up again when you turn it on.